
BOURSE SECURITIES LIMITED
29th April, 2019
SFC earnings decline
This week, we at Bourse review the financial results of Sagicor Financial Corporation Limited (SFC) and National Flour Mills Limited (NFM) for their financial years ended 31st December 2018. While SFC recorded commendable Revenue growth across all segments, overall profitability was impacted by certain one-off provisions related to the Government of Barbados debt restructuring. NFM, meanwhile, continues to challenges to growth. We take a closer look at the results and provide an outlook.
Sagicor Financial Corporation Limited (SFC)
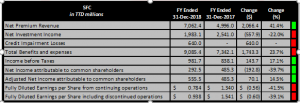
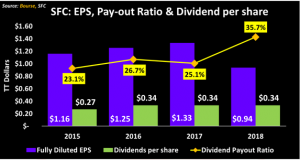
Sagicor Financial Corporation (SFC) reported total fully diluted Earnings per Share (EPS) of TT$0.94 for the financial year (FY) ended 31st December 2018, a reduction of 39.7% compared to the total fully diluted EPS of TT$1.55 reported for FY 2017. Total fully diluted EPS from continuing operations fell 41.5% year-on-year to TT$0.78 from TT$1.34.
Revenues Grow
Net Premium Revenue grew 41.4%, from TT$5.0B in FY 2017 to TT$7.06B in FY 2018. This was tempered by a TT$557.9M or 22.0% reduction in Net Investment Income YoY, from TT$2.54B to TT$1.98B generated in the comparable prior period. SFC’s Total Benefits and Expenses were 23.7% higher in 2018, amounting to TT$9.09B as compared to TT$7.34B in 2017. This increase was driven by a TT$725.8M (17.9%) rise YoY in Net Policy Benefits and a one-off Credit Impairment Loss of TT$640.0M in FY 2018. Other Income recorded a TT$107.1M improvement, from TT$15.2M in FY 2017 to TT$122.2M in FY 2018. Overall, SFC reported a considerable 17.2% increase in Income before Taxes, from TT$838.1M to TT$981.8M. Income Taxes for the year more than doubled the FY 2017 figure at TT$339.7M, representing an effective tax rate of 34.6% as compared to 15.4% in the previous year. As a result, Net income from continuing operations declined 9.4% to TT$642.0M in FY 2018 from TT$708.7M earned in FY 2017. Net Income for the year stood at TT$689.8M in 2018, 11.2% lower than the $776.4M recorded in the previous year. Net Income Attributable to Common Shareholders, when adjusted to exclude one-off expenses, amounted to TT$555.5M in 2018, up 14.5% from TT$485.3M in 2017.
Outlook
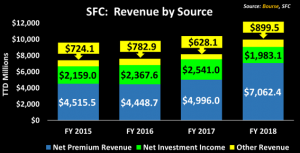
SFC’s Total Revenue has improved by more than 34% over the past three financial years. In 2018, the Group recorded a 41.4% surge in Net Premium Income, from TT$5.0B to TT$7.1B According to the Chairman, the improvement was primarily due to increased premiums from the USA segment, where the Group has opted to retain 100% of production instead of engaging in reinsurance. This was evident by a 42.8% cut in Reinsurance Premium Expense YoY, from TT$1.02B to TT$585.5M. A rise in Fee Income in the Group’s Jamaica through greater investment banking business also contributed to overall Revenue growth in FY 2018. On the other hand, Net Investment Income, which grew consistently over the two prior periods, recorded a decline of 22.1%, from TT$2.54B in FY 2017 to TT$1.98B in FY 2018. With broadly positive global financial markets in Q1 2019, SFC’s Net Investment Income could benefit.
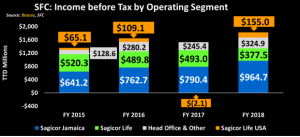
SFC’s Income before Tax (PBT) has fluctuated in recent years with PBT in 2018 amounting to TT$981.8M, up 17.2% compared to PBT of TT$838.1M in FY 2017. PBT generation from the Sagicor Jamaica segment has grown consistently over the past three years, from TT$641.2M in FY 2015, to TT$964.7M in FY 2018 (+50.5%). Sagicor Life USA recovered from incurring a Loss of TT$2.1M before taxes in 2017 to a profit of TT$155.0M in 2018. Contributions from Head Office and Other also improved by a significant 32.4% YoY. In contrast, PBT from Sagicor Life segment amounted to $377.5M in 2018, down 23.4% from the previous year.
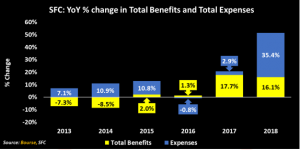
Overall, Total Benefits grew 16.1% or TT$709.5M, from TT$4.42B in 2017 to TT$5.13B in 2018, in line with Total Revenue growth as well as in response to the changing interest rate environment. Total Expenses experienced a significant increase of 35.4% YoY. SFC has now fully provisioned a total of US$98.8M (TT$662.0M) for the exchange of the Government of Barbados debt, which adversely affected profitability in 2018. SFC’s Income Tax in 2017 was significantly lower (TT$129.4M) than that of 2018 (TT$339.7M) due to a one-off tax benefit of US$14.2M (TT$95.1M) arising from the Tax Cuts and Jobs Acts in the USA segment. Nonetheless, the Effective Tax Rate (34.6%) was elevated when compared to the average Effective Tax Rate between 2014 to 2016 of 20.8%. As a result, Net Income for the Year fell 11.2% YoY, from TT$776.4M to TT$689.8M.
The Acquisition Proposition
A question on the mind of many SFC shareholders is whether or not Canadian-based Alignvest Acquisition II Corporation’s (AQY) scheme of arrangement with SFC will go ahead. Investors following these developments would recall that AQY shareholders are now set to vote on the proposed acquisition in May 2019. If approved, it would pave the way for SFC’s delisting from exchanges in the Caribbean and UK, instead being listed on the Toronto Stock Exchange. A successful transaction could offer benefits to SFC shareholders – opting to exchange their old SFC shares for new Sagicor shares – of improved trading liquidity and price discovery. From a financial perspective, a successful deal would give a green light for SFC’s acquisition of Scotiabank’s insurance operations in Trinidad and Tobago and Jamaica. Also on offer would be a wealth of international experience and support, as well as access to deeper and broader capital markets.
The Bourse View
At a current price of $8.60, SFC trades at a trailing P/E of 9.2 times, below the Non-Banking Finance sector average of 11.6 times (excluding NEL). The market-to-book ratio is 0.65, also below the sector average of 1.4. SFC offers investors a trailing dividend yield of 3.9%, higher than the Non-Banking Finance sector average of 3.1% (excluding NEL). With attractive valuations (after adjusting for one-off items), SFC remains a reasonably compelling addition to an investment portfolio. Should the AQY offer for SFC be approved and concluded, SFC’s attractiveness would be further enhanced. On this basis, Bourse upgrades its rating on SFC to BUY.
National Flour Mills Limited (NFM)
National Flour Mills Limited (NFM) reported Earnings per Share (EPS) of $0.19 for the financial year (FY) ended 31st December, 2018, a 29.6% decline from the EPS of $0.27 in the previous year.
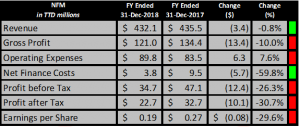
Revenue remained relatively flat at $432.1M, a 0.8% reduction from $435.4M in 2017. Gross Profit also declined 10.0% from $134.4M to $121.0M. Operating expenses expanded by $6.3M YoY from $83.5M to $89.8M. In contrast, Net Finance costs decreased by 59.8% or $5.7M, amounting to $3.8M in 2018. Nonetheless, Profit before Tax stood at $34.7M, down 26.3% from $47.1M in 2017. Overall, Profit for the year contracted 30.7% ($10.1M) to $22.7M from $32.7M in FY 2017.
Outlook
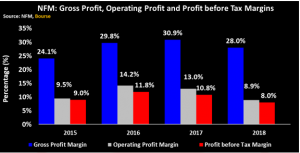
NFM’s Gross Profit Margin experienced a decline in FY 2018 from 30.9% to 28.0%, resulting from a $10.0M increase YoY in Cost of Sales which the Chairman attributed to narrowing of export margins. This was exacerbated by an 8% hike in grain prices and a total increase of $4.3M in wages and salaries for the year due to trade union pressure. Increases in transportation costs, wages and provision for bad debts collectively led to a $4.1M or 11.3% rise in Selling and Distribution Expenses. Therefore, Operating Profit Margin fell moderately from 13.0% to 8.9%. Of particular note was a $5.7M or 59.8% reduction in Net Finance Costs resulting from a $32M (26%) decline in Total Borrowings. Notwithstanding, Profit before Tax Margin, followed the trend of compression over the past periods, declining to 8.0% from 10.8% in FY 2017. Going forward NFM’s profitability will be dependent on its ability to foster sustainable revenue growth in both its domestic and international operations while containing costs to maintain or improve profit margins.
The Bourse View
At a current price of $1.75, NFM is trading at a trailing P/E of 9.2 times, well below the Manufacturing I Sector P/E of 22.9 times (excluding GML & UCL). NFM has reduced its annual dividend payment (subject to approval) from $0.10 to $0.07. The stock now offers investors a trailing dividend yield of 4.0%, in line with the sector average yield of 4.0% (excluding GML & UCL). On the basis of relatively low valuations but tempered by downward trending profit margins and the continued adverse impacts of the slow economic environment on operations, Bourse maintains a NEUTRAL rating on NFM.
For more information on these and other investment themes, please contact Bourse Securities Limited, at 226-8773 or email us at invest@boursefinancial.com.
“This document has been prepared by Bourse Securities Limited, (“Bourse”), for information purposes only. The production of this publication is not to in any way establish an offer or solicit for the subscription, purchase or sale of any of the securities stated herein to US persons or to contradict any laws of jurisdictions which would interpret our research to be an offer. Any trade in securities recommended herein is done subject to the fact that Bourse, its subsidiaries and/or affiliates have or may have specific or potential conflicts of interest in respect of the security or the issuer of the security, including those arising from (i) trading or dealing in certain securities and acting as an investment advisor; (ii) holding of securities of the issuer as beneficial owner; (iii) having benefitted, benefitting or to benefit from compensation arrangements; (iv) acting as underwriter in any distribution of securities of the issuer in the three years immediately preceding this document; or (v) having direct or indirect financial or other interest in the security or the issuer of the security. Investors are advised accordingly. Neither Bourse nor any of its subsidiaries, affiliates directors, officers, employees, representatives or agents, accepts any liability whatsoever for any direct, indirect or consequential losses arising from the use of this document or its contents or reliance on the information contained herein. Bourse does not guarantee the accuracy or completeness of the information in this document, which may have been obtained from or is based upon trade and statistical services or other third party sources. The information in this document is not intended to predict actual results and no assurances are given with respect thereto.”