BOURSE SECURITIES LIMITED
30th September, 2019
Pre-Budget Review – Part II – Expenditure, Savings, Debt
This week, we at Bourse continue our analysis of economic data in the lead up to the National Budget for the fiscal year 2019/2020. With some uncertainty as to whether revenues for FY2019/2020 will meet projections given the weaker tone of international energy markets, we turn our attention to the expenditure side of the budget equation. We also take a look at the current position of government borrowings and national savings, the facilities which have historically been drawn upon to fund the fiscal deficit.
Government Expenditure set to increase?
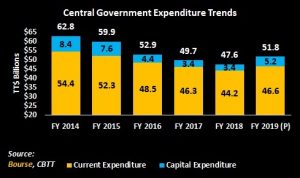
Central Government Expenditure has trended downward from a peak of $62.8B in FY 2014 to $47.6B in FY 2018. Initial projections in the FY 2019 Budget indicated an 8.8% year-on-year (YoY) increase in total expenditure to $51.8B, comprised of $46.6B Current Expenditure and $5.2B Capital Expenditure and Net Lending.
Actual expenditure would have strayed moderately from projections, according to the Honourable Minister of Finance in the mid-year budget review. For the fiscal half-year (Oct 2018- Mar 2019), government recurrent expenditure fell $2.55B shy of estimates at $23.63B driven by reductions in expenditure on goods and services and interest payments as a result of “tight cash flows”. However, the total expenditure projection for FY 2018/2019 was adjusted upward by $300M to $52.2B which, if realized, represents a 9.7% increase YoY. The revision was based on plans for increased infrastructural activity and the discharging of arrears to commercial suppliers and contractors as well as liquidating VAT refunds.
Transfers & Subsidies dominate Expenditure
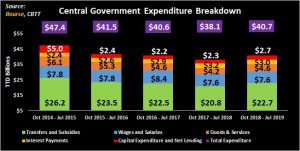
Transfers and Subsidies amounted to $22.7B (up 9.0% YoY) during the fiscal 10-month period (October 2018 – July 2019) and continue to represent the lion’s share of government expenditure, accounting for an average of 55.6% of total expenditure over the last five comparable periods. Expenditure on Goods and Services also increased by 11.5% YoY, while allocations to Wages and Salaries remained relatively flat at $7.6B (averaging 18.9% of Total Expenditure) and Interest payments fell from $3.2B to $3.0B. The allocation to Capital Expenditure has increased from $2.3B to $2.7B and now accounts for 6.7% of Total Expenditure, down from a high of 10.5% ($5.0B) during the comparable period of FY 2014/2015.
Fiscal Deficit Narrows
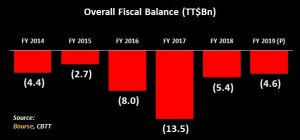
The overall fiscal deficit, or the difference between revenues and expenditures, has narrowed from $8.0B and $13.5B in FY2016 and FY2017 respectively, to $5.4B in FY2018. Given the downward revision to government revenue from $47.7B to $47.5B and the upward revision to expenditure, the deficit is now expected to amount to $4.57B for FY2019. Financing of the deficit was projected to consist of $3.826B in domestic financing and $225.7M in foreign financing.
Foreign Reserves fall
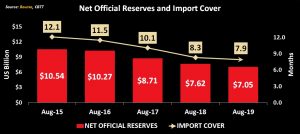
Net Official Reserves and Import Cover have been consistently declining over the past five years. Net Official Reserves have fallen from US$10.5B in 2015 to US$7.0B in 2019, a 33% reduction. On the other hand, Import Cover as at August 2019 stood at 7.9 months. Though this is well above the international standard of 3 months, it is well below the 12.1 month figure observed in 2015. Several factors would have accounted for this change, including lower Government Revenues from the Energy sector- a major foreign exchange contributor- as a result of lower levels of production and falling volatile energy prices. Relatively inelastic import demand, combined with the Central Bank’s efforts to maintain the TTD/USD exchange rate would have also placed a strong downward pressure on Net Official Reserves.
HSF grows
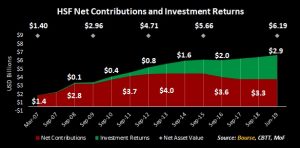
T&T’s Heritage and Stabilization Fund (HSF) remains a source of funding upon which the government can rely in instances where energy revenue falls more than 10% short of budgeted projections. Net contributions by the government since inception currently stand at US$3.3B. With a Net Asset Value of US$6.19B as at June 30th, 2019, the performance of the HSF has been predominantly driven by strong investment returns. The fund’s asset allocation consists of 38.9% equity and 61.1% fixed income investments.
Government Debt on the Rise
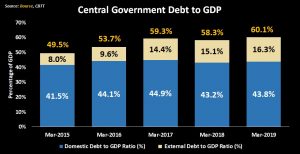
Government Debt-to-GDP levels have been gradually increasing over the past five years (March 2015- March 2019). Total Debt-to-GDP climbed from 49.5% in March 2015 to 60.1% in March 2019, largely on account of increased External Debt. As Revenues declined, Government would have relied on increased borrowing in order to finance its deficits and fulfil its foreign obligations. While Domestic Debt-to-GDP levels remained relatively stable over the five-year period, averaging 43.5% each year, External Debt-to-GDP levels have climbed from 8.0% in 2015 to 16.3% in 2019.
While mention has been made of the issuance of approximately $1B in housing bonds and a second offering of NIF-type bonds, none of these have yet come to market. Otherwise, it remains to be seen what additional measures will be put in place to fund the fiscal gap in light of the projected uptick in expenditure.
Investor Takeaways
It would appear that some combination of drawdowns on savings, borrowing and/or asset sales may be necessary to fund the likely fiscal deficit for FY2018/2019, should revenue and expenditure trends persist.
While investors may ponder which specific assets may be up for sale or used as collateral (as was the case of the NIF bonds), the more likely short-term solution to raising funds will be via borrowing. Although debt-to-GDP levels have climbed, they remain within comfortable international norms and below the 65% guidance level mentioned by the Honourable Prime Minister in past communications.
In an environment in short supply of fixed income investment opportunities, investors will be looking out for opportunities to acquire relatively safe fixed income assets while aiding the sovereign in funding its expenditure initiatives.
For more information on these and other investment themes, please contact Bourse Securities Limited, at 226-8773 or email us at invest@boursefinancial.com.
“This document has been prepared by Bourse Securities Limited, (“Bourse”), for information purposes only. The production of this publication is not to in any way establish an offer or solicit for the subscription, purchase or sale of any of the securities stated herein to US persons or to contradict any laws of jurisdictions which would interpret our research to be an offer. Any trade in securities recommended herein is done subject to the fact that Bourse, its subsidiaries and/or affiliates have or may have specific or potential conflicts of interest in respect of the security or the issuer of the security, including those arising from (i) trading or dealing in certain securities and acting as an investment advisor; (ii) holding of securities of the issuer as beneficial owner; (iii) having benefitted, benefitting or to benefit from compensation arrangements; (iv) acting as underwriter in any distribution of securities of the issuer in the three years immediately preceding this document; or (v) having direct or indirect financial or other interest in the security or the issuer of the security. Investors are advised accordingly. Neither Bourse nor any of its subsidiaries, affiliates directors, officers, employees, representatives or agents, accepts any liability whatsoever for any direct, indirect or consequential losses arising from the use of this document or its contents or reliance on the information contained herein. Bourse does not guarantee the accuracy or completeness of the information in this document, which may have been obtained from or is based upon trade and statistical services or other third party sources. The information in this document is not intended to predict actual results and no assurances are given with respect thereto.”