BOURSE SECURITIES LIMITED
18th March, 2019.
FCI, SBTT Deliver Mixed Results
This week, we at Bourse review the financial performance of the two Canadian-owned banking giants listed on the Trinidad and Tobago Stock Exchange (TTSE), Scotiabank Trinidad and Tobago Limited (SBTT) and FirstCaribbean International Bank Limited (FCI). We take a closer look at the financial results and provide an outlook.
Scotiabank Trinidad and Tobago Limited (SBTT)
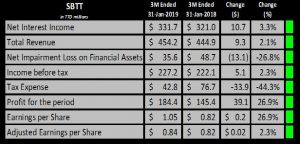
Scotiabank Trinidad & Tobago Limited (SBTT) reported Earnings per Share (EPS) of $1.05 for the first quarter ended 31st January, 2019, compared to $ 0.82 reported in the same period of 2018.
SBTT recorded a 3.3% improvement year-on-year (YoY) in Net Interest Income, from $321.0M to $331.7M. Total Revenue amounted to $454.2M, a modest increase of 2.1% or $9.3M over the previous year’s comparative results. Non-Interest Expenses rose $17.2M or 9.9% over the comparable period. Resultantly, Income before Taxation and Loan Loss fell to $262.6M, 2.9% lower than that of 2018. In contrast, Net Impairment Loss on Financial Assets was $13.1M or 26.8% lower than the prior comparable period, closing at $35.6M in Q1 2019. Income Before Taxation (PBT) experienced growth of 2.3%, moving from $222.1M in Q1 2018 to $227.2M in Q1 2019. SBTT’s Provision for Tax was significantly lower in Q1 2019, falling from $76.7M to $42.8M, a 45.5% decline. This decline was attributable to a favourable tax credit, reducing the period’s effective tax rate to 18.8% from 34.5% in the prior comparable period. Profit for the Period rose 26.9% from $145.4M to $184.4M for the Q1 period 2019.
Outlook
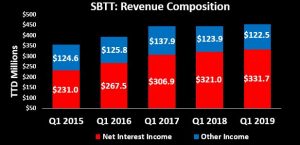
The improvement in Net Interest Income was one of the main drivers of SBTT’s performance in Q1 2019. Net Interest income has shown steady growth over comparable periods of the past five years, rising over 48% since Q1 2015. In 2019, this growth was attributed to expansion in the retail and commercial loan portfolios, mainly through a $1.04B (7.4%) increase in Loans to Customers, but tempered by a dip in Loans and Advances to Banks and Related Companies of $636.8M (51.2%).
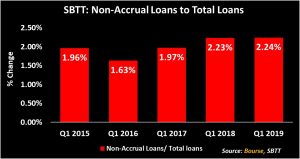
Despite the fact that the ratio of Non-Accrual Loans to Total Loans has increased consistently over the past four comparable quarters, rising to 2.24% in Q1 2019, SBTT was able to curb its Net Impairment Loss on Financial Assets in Q1 2019 through continued risk mitigation strategies in managing its Loan Loss provisions. Furthermore, SBTT benefitted from a significant reduction in Provision for Tax on account of a Tax Credit during the period. Adjusting this expense to reflect an Effective Tax Rate of 34.5% (consistent with that of the previous year), Profit for the Period would have amounted to $148.7M, a marginal increase of 2.3% over Q1 2019. EPS would have adjusted accordingly to $0.84.
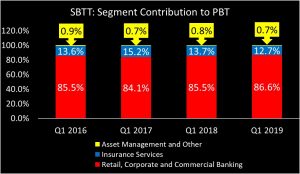
Segmental Analysis showed that the Retail, Corporate and Commercial Banking segment contributed 86.6% of total PBT in Q1 2019. This was due to the increase in SBTT’s prime lending rate from 9.0% to 9.25% in September 2018 as well as YoY growth in the loan portfolios. Conversely, contributions from the Insurance segment fell to 12.7% of total PBT and has shown consistent decline since 2017. Looking forward, SBTT is expected to benefit from the sale of its Insurance subsidiaries and partnership with Sagicor Financial Corporation (SFC), through enhanced expertise and the offering of market-leading insurance products and solutions. This arrangement is contingent on the acquisition of SFC by Alignvest Acquisition II Corporation, as well as regulatory approval.
The Bourse View
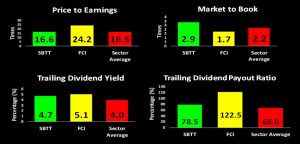
At a current price of $63.59, SBTT trades at a trailing PE of 16.6 times, in line with the Banking Sector average of 16.5 times and its three-year average of 16.4 times. The stock offers investors a trailing dividend yield of 4.7%, also higher than the Banking Sector average of 4.0%, with a payout ratio of 78.5%. In light of marginal growth in profitability and fair valuations, Bourse maintains a NEUTRAL rating on SBTT.
FirstCaribbean International Bank Limited (FCI)
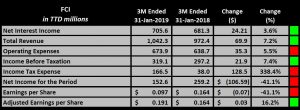
FirstCaribbean International Bank Limited (FCI) reported Earnings per Share (EPS) of TT$ 0.10 (US$ 0.014) for the first quarter (Q1) ended January 31st, 2019, a 41.7% decline compared to TT$0.16 (US$0.024) reported in Q1 2018.
Net interest income increased 3.4% from TT$681.3M in Q1 2018 to TT$705.6M in Q1 2019. Total Revenue for the period grew to TT$1.04B, 7.2% higher than TT$972.4M reported in the previous year’s comparative period. Operating expenses also increased $35.3M or 5.5%. year-on-year (YoY), amounting to $673.9M for the quarter. FCIB’s Credit Loss Expense on Financial Assets was 34.9% higher at TT$49.3M, compared to TT$36.5M reported in the first quarter of 2018. Income Tax Expense increased by TT$128.5M to TT166.5M in Q1 2019, compared to the TT$38.0M incurred in Q1 2018. As a result, Net income for the period declined 41.1% from TT$259.2M to TT$152.6M.
Outlook
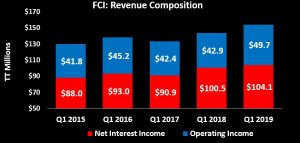
Over the last three comparable quarters, FCI reported consistent growth in Total Revenue. In Q1 2019, the improvement (7.2%) in Total Revenue was attributable to growth in Interest Income from performing loans, cash placements and foreign exchange gains. According to the Chief Executive Officer’s statements, Net Income, when adjusted to exclude items of note would have improved by US$6.2M or TT$ 42.0M. Among these items was a Deferred Tax Asset write-off of TT$148.5M, as a result of the Corporate Tax Rate changes in Barbados, which was the major driver of the YoY decline in Net Income. This was exacerbated by a TT$29.8M incremental provision for credit losses related to the restructuring of Government of Barbados US dollar denominated debt offset by a partial release of credit loss allowances related to hurricanes in 2017. Adjusting EPS to account for these items resulted in a YoY improvement of 16.2%, or an EPS of TT$0.19 in Q1 2019.
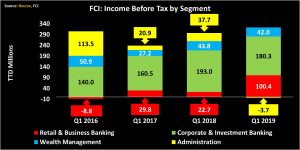
FCI reported declines in Income before Tax contributions from three of four segments in Q1 2019. The Corporate and Investment Banking (CIB) and Wealth Management (WM) segments’ contributions dipped to TT$26.6M and TT6.2M respectively (a drop of 6.6% and 4.1% respectively), while contributions from the Administration segment fell TT$6.1M. In contrast, the contribution from the Retail and Business Banking (RBB) segment more than tripled the previous year’s comparative results, amounting to TT$14.8M in Q1 2019. Growth in this segment was fuelled by higher interest earnings in performing loans, which expanded 4% YoY after adjusting for the early repayment of a loan previously made to a major shareholder.
The Bourse View

At a current price of $8.35, FCI trades at a trailing P/E of 24.2 times, well above the Banking sector average of 15.5 times and its three-year average of 16.1. times. On an adjusted basis (excluding the significant one-off items), FCI’s P/E ratio would be 12.8 times. The stock offers investors a trailing dividend yield of 5.1%, above the sector average of 4.0% and also provides a hedge against further depreciation of the TTD. On the basis of moderate improvement in earnings (barring one-off expenses), but tempered by relatively high valuations, Bourse maintains a NEUTRAL rating on FCI.
For more information on these and other investment themes, please contact Bourse Securities Limited, at 226-8773 or email us at invest@boursefinancial.com.
“This document has been prepared by Bourse Securities Limited, (“Bourse”), for information purposes only. The production of this publication is not to in any way establish an offer or solicit for the subscription, purchase or sale of any of the securities stated herein to US persons or to contradict any laws of jurisdictions which would interpret our research to be an offer. Any trade in securities recommended herein is done subject to the fact that Bourse, its subsidiaries and/or affiliates have or may have specific or potential conflicts of interest in respect of the security or the issuer of the security, including those arising from (i) trading or dealing in certain securities and acting as an investment advisor; (ii) holding of securities of the issuer as beneficial owner; (iii) having benefitted, benefitting or to benefit from compensation arrangements; (iv) acting as underwriter in any distribution of securities of the issuer in the three years immediately preceding this document; or (v) having direct or indirect financial or other interest in the security or the issuer of the security. Investors are advised accordingly. Neither Bourse nor any of its subsidiaries, affiliates directors, officers, employees, representatives or agents, accepts any liability whatsoever for any direct, indirect or consequential losses arising from the use of this document or its contents or reliance on the information contained herein. Bourse does not guarantee the accuracy or completeness of the information in this document, which may have been obtained from or is based upon trade and statistical services or other third party sources. The information in this document is not intended to predict actual results and no assurances are given with respect thereto.”

