HIGHLIGHTS
- Banking Sector Performance Outlook
- Improving Net Interest Income
- Increased Demand for Loans
- Improving Cost Management
- Economic Activity Normalization
- FirstCaribbean International Bank Limited: 9M2022 Earnings Per Share TT$0.52, ↑ 39.3% YoY
- First Citizens Group Financial Holdings Limited: 9M2022 Earnings Per Share $2.05, ↑ 6.2% YoY
- NCB Financial Group Limited: 9M2022 Earnings Per Share TT$0.36, ↑ 89.5% YoY
- Republic Financial Holdings Limited: 9M2022 Earnings Per Share $7.01, ↑ 10.4% YoY
- Scotiabank Trinidad and Tobago Limited: 9M2022 Earnings Per Share 2.96, ↑12.8% YoY
This week, we at Bourse review the Banking Sector of the Trinidad and Tobago Stock Exchange (TTSE), the largest sector by value or market capitalization accounting for over half of the TTSE’s total market value. Despite volatile financial markets and heightened uncertainty at the global level, banking sector earnings have – on aggregate – largely improved over the course of 2022. Does positive earnings momentum in the TTSE’s largest sector signal brighter economic fortunes ahead, or could swirling economic headwinds dampen economic activity in the months ahead? We discuss below.
Bank Earnings Bounce
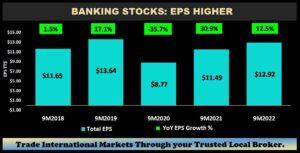
The Banking Sector accounts for roughly 53.5% of total index value on the Trinidad and Tobago Stock Exchange (TTSE). For the nine-month period of banks’ respective fiscal 2022 (9M2022), earnings improved over the prior comparable period. Banks’ total Earnings per Share (EPS) – assuming an investor held one share of each banking company/group – for 9M2022 amounted to $12.92 relative to $11.49 in 9M2021, representing a 12.5% increase year-on-year. While not yet back to the levels of 9M2019 ($13.64), Banking Sector earnings have continued to recover from the recent 9M2020 low of $8.77 per share when the Covid-19 Pandemic brought entire economies to a near-halt.
Banking ‘Market Cap’ Lower
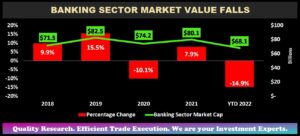
Despite a recovery in earnings for each of the banking stocks, four of the five listed banks recorded lower prices year-to-date with shares of NCBFG (↓40.0%) dragging the sector lower. SBTT was the only banking stock with a positive year-to-date change in its stock price (↑13.6%).
Data from the Trinidad and Tobago Stock Exchange (TTSE) showed that the value (market capitalization) of publicly-listed Banking stocks appreciated 12.0% from $71.5B in 2018 to $80.1B at the end of 2021. On a year-to-date basis, the sector’s market capitalization has contracted 14.9% to $68.1B.
Better value in Banking Stocks?
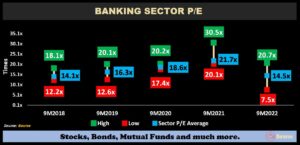
The Banking Sector Price to Earnings (P/E) Average continuously expanded during 9M2018 to 9M2021 from 14.1 times to 21.7 times. The P/E ratio is a simple but effective gauge of how much investors are willing to pay for every dollar of earnings generated by a company. Higher P/E multiples suggest stocks are more expensive. Elevated P/E multiples were evident in 9M2021, with the most expensive banking stock trading at a P/E of 30.5 times and the cheapest at a P/E multiple of 20.1 times, with fairly rapid price advances outpacing earnings growth.
Some degree of mean reversion has taken place during 9M2022, with a combination of stock price correction and earnings improvement resulting in improving P/E multiples. Banking sector P/E multiples are now fairly comparable with pre-COVID levels, with the P/E sector average of 14.5 times in 9M2022 relative to the pre-Covid19 level of 14.1 times in 9M 2018. The range of P/E multiples across individual stocks has also widened, suggesting investors could be more discerning in stock selection. For example, as at 9M2022, FirstCaribbean International Bank Limited (FCI) currently trades at the most relatively attractive P/E ratio (7.5x), as compared to the Scotiabank Trinidad and Tobago Limited (SBTT) which trades at the relatively most expensive P/E multiple (20.7x).
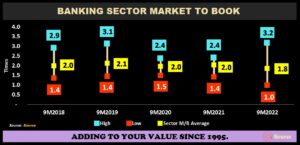
In terms of the Market to Book (M/B) multiple – the market price per share relative to the book/carrying value of a company’s net assets per share, the sector average has remained relatively consistent around 2.0 times during 9M2018 to 9M2022.
While average M/B ratios have displayed stability, the range of M/B ratios across individual stocks widened as at 9M2022 after narrowing in 9M2020 and 9M2021. The widening range suggests there may be opportunities for investors to be more selective in choosing individual stocks within the banking sector if searching for relative value. For example, as at 9M2022, FCI currently trades at the most relatively attractive M/B ratio (1.0x), as compared to the SBTT which trades at the relatively most expensive M/B multiple (3.2x).
Cost Management Improves
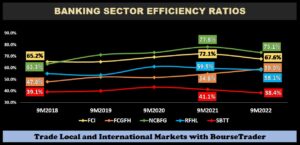
The Efficiency Ratio is a measure of how well Banks manage their expenses, relative revenue generation (lower ratio = better performance). With the exception of FCGFH, all other banks were able to improve their efficiency ratios in 9M2022. NCBFG improved its efficiency ratio, improving from 77.9% in 9M2021 to 73.1% in 9M2022. FCI lowered its ratio to 67.6% in 9M2022 from 72.1% in 9M2021. Other banks, including RFHL and SBTT, also managed to lower their efficiency ratios in 9M2022. FCGFH’s efficiency ratio increased from 54.8% to 59.0% in 9M2022. This general improvement in efficiency ratios could be an indicator of improved banking profitability in subsequent periods.
Credit Quality Recovers
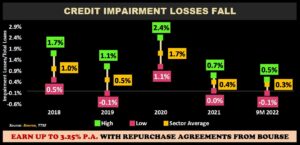
Impairment Losses as a percentage of Total Loans sharply declined from highs seen in 2020. Impairment Losses tend to rise in tandem with the growth of loan portfolios, however the heightened uncertainty caused by the Covid-19 pandemic drove provisions up to a sector average of 1.7%. Despite growing inflationary pressures throughout the region, impairment losses fell to an average of 0.3% in 9M 2022 against a backdrop of recovering economic activity. The reduction of impairment losses may signal an improvement in perceived quality of banks’ loan portfolios as the probability of delinquency, distress and/or default abates.
Investor Considerations
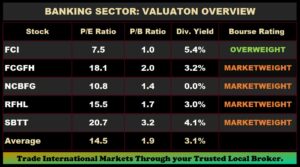
The Banking Sector has, through a combination of factors, returned to more attractive territory from an investment perspective. Investors considering Banking stocks on the TTSE have a fairly wide menu, ranging from T&T-focused franchises specializing in more traditional banking services such as SBTT, to regionally diverse conglomerates with significant banking and insurance reaches (like NCBFG).
For income-focused investors, stocks such as SBTT and FCI currently offer more attractive dividend yields of 4.1% and 5.4% respectively, while FCI also offers the added benefit of receiving dividends in US dollars. Growth-focused banking sector investors might look at RFHL and NCBFG, who have executed multiple acquisitions over the past several years. FCGFH may also be on the minds of investors seeking banks with expansionary ambitions, given the recent Group’s (but ultimately unsuccessful) attempt to enter the Guyana market, as well as its recent 19.9% stake in web-based lender Term Finance (Holdings) Limited.
From a macroeconomic perspective, banks’ financial performance in subsequent periods will depend on the health of regional economies and associated activity. For now, the impact of inflationary pressures and the rising cost of living on disposable income and credit demand appear to have been more than offset by the momentum generated from ‘post-COVID’ economic reopening. While it remains to be seen if this momentum carries forward, recent results suggest that banks (and the underlying economies they serve) appear to be recovering reasonably well after a challenging 2-year period.
“This document has been prepared by Bourse Securities Limited, (“Bourse”), for information purposes only. The production of this publication is not to in any way establish an offer or solicit for the subscription, purchase or sale of any of the securities stated herein to US persons or to contradict any laws of jurisdictions which would interpret our research to be an offer. Any trade in securities recommended herein is done subject to the fact that Bourse, its subsidiaries and/or affiliates have or may have specific or potential conflicts of interest in respect of the security or the issuer of the security, including those arising from (i) trading or dealing in certain securities and acting as an investment advisor; (ii) holding of securities of the issuer as beneficial owner; (iii) having benefitted, benefitting or to benefit from compensation arrangements; (iv) acting as underwriter in any distribution of securities of the issuer in the three years immediately preceding this document; or (v) having direct or indirect financial or other interest in the security or the issuer of the security. Investors are advised accordingly. Neither Bourse nor any of its subsidiaries, affiliates directors, officers, employees, representatives or agents, accepts any liability whatsoever for any direct, indirect or consequential losses arising from the use of this document or its contents or reliance on the information contained herein. Bourse does not guarantee the accuracy or completeness of the information in this document, which may have been obtained from or is based upon trade and statistical services or other third party sources. The information in this document is not intended to predict actual results and no assurances are given with respect thereto.”
