
HIGHLIGHTS
FCI 9M2022
- Earnings: Earnings Per Share 39.3% higher, from TT$0.37 to TT$0.52
- Performance Drivers:
- Increased Revenue
- Lower Provision for Credit Losses
- Outlook:
- Interest Rate Normalization
- Economic Uncertainty
- Rating: Maintained at OVERWEIGHT
SBTT 9M2022
- Earnings: Earnings Per Share 12.8% higher, from $2.62 to $2.96
- Performance Drivers:
- Higher Revenues
- Increased Operational Efficiency
- Outlook:
- Economic Uncertainty
- Rating: Maintained at MARKETWEIGHT.
This week, we at Bourse review the performance of two locally listed banks, FirstCaribbean International Bank Limited (FCI) and Scotiabank Trinidad and Tobago Limited (SBTT) for the nine-month period ending July 31st, 2022 (9M2022). SBTT benefitted from increased revenues and FCI improved on the basis of higher interest rates and lower provision for credit losses. Could both entities continue its momentum despite the still uncertain operating environment? We discuss below.
FirstCaribbean International Bank Limited (FCI)

FCI reported an Earnings Per Share (EPS) of TT$0.52 for the nine-months ended 31st July, 2022 (9M2022), relative to an EPS of TT$0.37 in the prior year.
Total Revenue amounted to TT$2.89B, 8.4% higher Year on Year (YoY). Operating Expenses marginally increased 1.7% from TT$1.92B to TT$1.95B. FCI reported a reversal on Credit Loss Expense on Financial Assets in the amount of TT$51.5M, due to improvements in macro-economic conditions. Consequently, the Bank reported an Income Before Taxation of TT$987.7M, 55.3% higher than TT$635.8M in 9M2021. The Group’s effective tax rate increased from 5.8% in 9M2021 to 12.8% in the period under review. Overall, Net Income for the Period amounted to TT$818.7M relative to TT$586.7M in 9M2021. Net Income attributable to Equity holders was reported at TT$818.7M, TT$231.9M higher than the comparable period.
Revenue Recovers
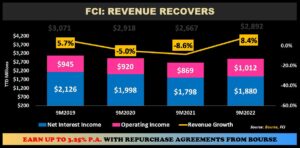
FCI’s Total Revenue improved in 9M2022, up 8.4% after declining in the prior period, as the Group benefitted from rising US interest rates.
Net Interest Income, the Group’s largest revenue contributor (9M2022: 65.0%) advanced 4.6% to TT$1.9B, though it has not bounced back to pre-COVID levels. The Group’s loan portfolio modestly increased 1.0% YoY to TT$43.9B in 9M2022 due to a recovery in economic activity in the period. Operating Income, which include net fees and commissions income accounted for 35.0% of Total Revenue and increased 16.4% to TT$1.0B.
Operating Segment Advance

FCI’s PBT expanded 55.3% during the period, primarily owing to a reversal of Credit Loss Expense on Financial Assets associated with its Corporate and Investment Banking (CIB) segment.
FCI’s CIB segment reported a Profit Before Tax of TT$878M, 63.6% higher YoY. Retail, Business and International Banking (RBB) recorded a Profit Before Tax of TT$69M in 9M2022 compared to TT$58M in the prior comparable period. Wealth Management recorded an increase in PBT from TT$19M to TT$89M, up 360.5% in 9M2022, as segmental revenue grew 18.6% despite volatile financial markets.
On July 15th, 2022 – FCI received regulatory approval for the sale of its banking assets in St. Vincent and the Grenadines and in St. Kitts and Nevis, whereas Grenada’s sale of banking assets is still pending approval. The Group announced on September 1st, 2022 that its wholly owned subsidiary, FCIB Barbados will close its branch in Dominica on January 31st, 2023, subject to regulatory approval. These divestitures support the Group’s strategy of simplifying its operations.
The Bourse View

At a current price of TT$5.00, FCI trades at a Trailing Price to Earnings ratio of 7.5 times, significantly below the Banking sector’s average of 14.6 times. The stock also offers investors a Trailing Dividend Yield of 5.4%, above the sector average of 3.1%. FCI has benefitted from the recovery in economic activity in recent months, reflected by higher revenues and reversal of credit losses. However, continued inflationary pressures and the resultant lower disposable income could result in a weaker consumer in the near to medium term. On the basis of improved performance, attractive valuations and recovering dividends, Bourse maintains an OVERWEIGHT rating on FCI.
Scotiabank Trinidad and Tobago Limited (SBTT)

Scotiabank Trinidad and Tobago Limited (SBTT) reported earnings per share (EPS) of $2.96 for the nine-month period ended July 2022 (9M2022), a 12.8% increase compared to $2.62 in the prior comparable period.
Net Interest Income fell 1.3% to $916.1M while Other Income expanded 38.7% from $374.6M in 9M2021 to $519.5M in 9M2022. Total Revenue for 9M2022 stood at $1.4B, a 10.2% increase from the prior period. Non-Interest Expenses shifted 2.8% higher from $535.9M in 9M2021 to $551M in 9M2022 as a result of higher volume-related activity costs. SBTT recorded a 29.3% increase in Net Impairment Loss on Financial Assets, amounting to $84.7M (9M2021: $65.5M). Income before Taxation moved from a previous $701.5M to $800.1M, a 14.1% increase. Income Tax Expense amounted to $279.1M in 9M 2022 for an effective tax rate of 34.9%, relatively consistent with a previous of 34.2%. Overall, SBTT reported a Profit for the Period of $521.1M, up 12.8% compared to $461.8M in 9M2021.
Revenues Higher
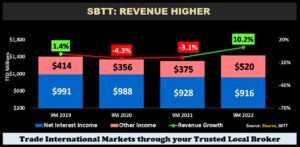
SBTT’s Total Revenue recovered in 9M2022 (up 10.2%) after falling in the prior comparable period. Net Interest Income, the Group’s largest revenue contributor (9M2022: 63.8%) fell 1.3% or $12.1M. According to SBTT, this was a mainly due to margin compression resulting from a competitive rate environment for consumer credit. Other Income (36.2% of Total Revenue) recorded a 38.7% increase driven by increased transaction activity in its retail and commercial banking segments.
The Bank’s largest operational segment by revenue, Retail Corporate & Commercial Banking (90.4% of Total Revenue) and its Asset management segment expanded 10.1% and 107.2% respectively, year-on-year. Its Insurance Services segment grew 6.4%, demonstrating customers’ continued confidence in the Group’s product offerings.
Loans, Impairment Expenses Increase
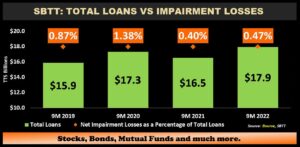
SBTT recorded an 8.4% increase in its Total Loan Portfolio from $16.5B in 9M 2021 to $17.9B in 9M 2022, as continued recovery in economic activity stabilized loan demand.
Loans to Customers (94.8% of Total Loans), the Bank’s largest interest earnings asset, increased 7.5% driven by increased demand following competitive offerings made to both retail and commercial segments and enhanced digital customer engagement initiatives. Loans and advances to banks and related companies advanced 28.3%.
Net Impairment losses on financial assets increased to $84.7M from $65.5M in the prior period, resulting in an increase in the ratio of Net Impairment Losses to Total Loans to 0.47% from 0.40% in 9M 2022. The Group’s ratio of non-performing loans as a percentage of gross loans improved from 2.3% to 1.9% in the period under review.
The Bourse View

SBTT is currently priced at $78.09, up 14.0% year-to-date. The stock trades at a Trailing Price to Earnings ratio of 20.8 times, above the Banking Sector average of 14.6 times. The stock offers investors a Trailing Dividend Yield of 4.0%, above the sector average of 3.1%. SBTT’s dividend yields continue to remain healthy, reaffirming its commitment to maximize shareholders’ return in the form of dividend payments (pay-out ratio: 77.8% in 9M 2022) as well as capital appreciation. On the basis of improved performance and consistent dividend payments, but tempered by elevated valuations, Bourse maintains a MARKETWEIGHT rating on SBTT.
“This document has been prepared by Bourse Securities Limited, (“Bourse”), for information purposes only. The production of this publication is not to in any way establish an offer or solicit for the subscription, purchase or sale of any of the securities stated herein to US persons or to contradict any laws of jurisdictions which would interpret our research to be an offer. Any trade in securities recommended herein is done subject to the fact that Bourse, its subsidiaries and/or affiliates have or may have specific or potential conflicts of interest in respect of the security or the issuer of the security, including those arising from (i) trading or dealing in certain securities and acting as an investment advisor; (ii) holding of securities of the issuer as beneficial owner; (iii) having benefitted, benefitting or to benefit from compensation arrangements; (iv) acting as underwriter in any distribution of securities of the issuer in the three years immediately preceding this document; or (v) having direct or indirect financial or other interest in the security or the issuer of the security. Investors are advised accordingly. Neither Bourse nor any of its subsidiaries, affiliates directors, officers, employees, representatives or agents, accepts any liability whatsoever for any direct, indirect or consequential losses arising from the use of this document or its contents or reliance on the information contained herein. Bourse does not guarantee the accuracy or completeness of the information in this document, which may have been obtained from or is based upon trade and statistical services or other third party sources. The information in this document is not intended to predict actual results and no assurances are given with respect thereto.”