HIGHLIGHTS
NCBFG 9M 2022
- Earnings: EPS rose 94.0% from $0.36 to $0.19
- Performance Drivers:
- Increased Income from Banking and Insurance Activities
- Higher Operating Expenses
- Outlook:
- Recovering Financial Markets
- Rating: Maintained at MARKETWEIGHT.
GHL HY 2022
- Earnings: EPS increased 70.9% from $1.10 to $1.88
- Performance Drivers:
- Higher Net Income from Insurance Activities
- Decline in Net Income from Investing Activities
- Increased Fee and Commission Income
- Outlook:
- Recovering Financial Markets
- Rating: Maintained at MARKETWEIGHT.
This week, we at Bourse review the performance of NCB Financial Group Limited (NCBFG) for the nine months ended June 30th, 2022 (9M 2022) and Guardian Holdings Limited (GHL) for the six months ended June 30th 2022 (HY 2022). Both Groups benefitted from increased Net Premium Income but were negatively affected by high levels of volatility in financial markets. What might investors expect in the months ahead? We discuss below.
NCB Financial Group Limited (NCBFG)
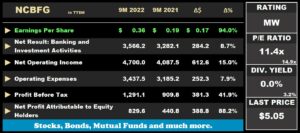
NCBFG reported Earnings Per Share of TT$0.36 for the nine months ended June 30th 2022, 94.0% higher than TT$0.19 reported in the prior comparable period. The Group’s Net Interest Income expanded 17.6% to TT$2.2B from a prior TT$1.8B. Net Fee and Commission Income increased 13.5% to TT$852.0M, relative to TT$750.3M in 9M 2021. Gains on FX and Investment Activities fell 42.9% to TT$312.5M. Credit Impairment Losses fell from TT$97.1M in the prior period to TT$83.2M, down 14.4% year-on-year.
Net Result from Banking and Investment Activities rose 8.7%, moving from TT$3.3B in 9M 2021 to TT$3.6B in 9M 2022. Net Result from Insurance Activities advanced 40.8% to TT$1.1B. Overall, Net Operating Income stood at TT$4.7B, 15.0% higher than the prior comparable period. Operating Expenses climbed 7.9% to TT$3.4B relative to a previous TT$3.2B.
Operating Profit advanced 39.9% to TT$1.3B from a prior TT$902.3M. Profit Before Tax increased 41.9% YoY to TT$1.3B. Taxation Expense fell 48.0% with the effective taxation rate moving from 31.9% in 9M 2021 to 10.8% in 9M 2022. Net Profit totalled TT$1.2B or an 86.0% increase, while Net Profit Attributable to Shareholders rose to TT$829.6M from TT$440.8M, 88.2% higher.
Operating Income Climbs
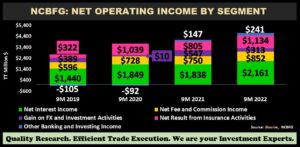
NCBFG reported a 15.0% increase in Net Operating Income for the period under review. Net Interest Income, the largest component of Net Operating Income (46.0%), expanded 17.6% as the Group recorded strong growth in its interest earning portfolios. NCBFG’s loan portfolio and customer deposits increased 10.9% and 11.1% respectively, signalling continued loan demand across its operating jurisdictions.
Net Result from Insurance Activities (24.1% of Net Operating Income) advanced 40.8%, driven by strong performance in its life and health insurance segment as a result of improved net premium income. Net Fee and Commission Income (13.5% of Net Operating Income) climbed 13.5% to TT$852.0M, primarily due to higher transaction volumes within the payment services segment. Gains on Foreign Currency and Investment Activities fell 42.9% from TT$547.1M in 9M 2021 to TT$312.5M, likely due to volatile financial markets during the period. Other Banking and Investing Income rose 63.6% to TT$240.6M, led by gains in dividend income and other operating income.
Operating Profit by Activity
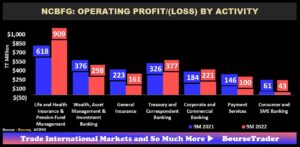
The Group recorded year-on-year Operating Profit growth in three of its seven segments. Life and Health Insurance & Pension Fund Management, which accounts for 43.1% of Operating Profit, advanced 47.0% from TT$618M to TT$909M in 9M 2022 as a result of increased business activity. Corporate and Commercial Banking (10.5% of Operating Profit) reported a strong performance, increasing 20.1% YoY from TT$184M to TT$221M in the current quarter as demand for loans continue to grow. Conversely, Payment Services contracted 31.5%, weighed by a 40.4% increase in segment operating expenses.
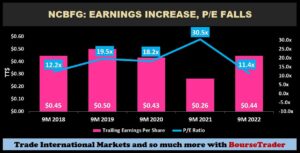
NCBFG posted an EPS of $0.36 in 9M 2022, up 94.0% from $0.19 in the prior comparable period bringing its trailing 12-month EPS to $0.44. Following a strong recovery in earnings and a 37.0% decrease in share price year-to-date, the Group’s Price-to-Earnings (P/E) multiple has adjusted from a lofty 30.5 times in 9M 2021 to 11.4 times in 9M 2022.
Outlook
The prospect of regional growth remains promising, as data from the United Nations World Tourism Organization showed that global international tourist arrivals more than doubled in Q1 2022, which may bode well for NCBFG’s operational jurisdictions. Based on NCBFG’s 2021 annual report, Jamaica remains its largest jurisdiction by Operating Income, accounting for 55%. Trinidad and Tobago is the second largest with 15%, with the Dutch Caribbean accounting for 8%, Bermuda at 5% and other at 17%. This outlook could be tempered by fresh headwinds in the form of inflation and rising interest rates, which (should they persist) have the potential to adversely impact the Group’s loan portfolio growth
The Bourse View
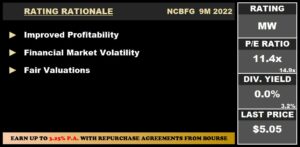
NCBFG is currently priced at $5.05 and trades at a price to earnings ratio of 11.4 times, below the Banking Sector average of 14.9 times. The Group made the decision to not declare an interim dividend payment in its latest earnings release.
The gradual recovery in financial markets should bode well for NCBFG’s Investment Activities segment, as the Group continues to show resilience in its Banking and Insurance segments. Moreover, widespread economic recovery across its operating jurisdictions could serve as a tailwind for growth in subsequent periods. On the basis of improved performance, relatively fair valuations, but tempered by the absence of dividends to shareholders, Bourse maintains a MARKETWEIGHT rating on NCBFG.
Guardian Holdings Limited (GHL)
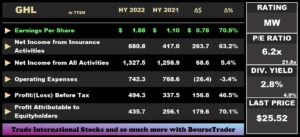
Guardian Holdings Limited (GHL) reported Earnings per Share (EPS) of $1.88 for the six months ended June 30th 2022 (HY 2022), up 70.9% from $1.10 in the prior comparable period.
Net Result from Insurance Activities advanced 63.2% to $680.8M relative to a prior $417.0M. Net Income from Investing Activities contracted 25.9%, moving from a previous $769.9M to $570.4M in HY 2022, attributable to high levels of volatility across financial markets. Fee and Commission Income from Brokerage Activities stood at $76.3M, 6.0% higher. Cumulatively, Net Income from All Activities advanced 5.4%, amounting to $1.3B in HY 2022 (HY 2021: $1.2B).
GHL recorded a Net Impairment Gain on Financial Assets of $2.1M in HY 2022, relative to an Impairment Loss of $58.8M in HY 2021. Operating Expenses and Finance Charges amounted to $742.3M and $103.8M respectively. Consequently, GHL reported an Operating Profit of $483.5M in HY 2022, 47.2% higher relative to a prior $328.5M. Share of Profit of Associate Companies increased 20.6% to $10.9M in HY 2022. GHL recorded a 46.5% increase in its Profit Before Taxation (PBT) which amounted to $494.3 (HY 2021: $337.5M). The Groups Taxation Expense stood at $45.2M (down 41.5%) with the effective tax rate falling from 22.9% in HY2021 to 9.1% in HY 2022. Overall, Profit Attributable to Equity Holders of the Company rose 70.1% to $435.7M, compared to a previous $256.1M.
Insurance Income Boosts Performance
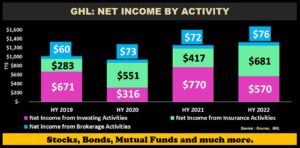
Net Income from All Activities increased 5.4% during the six-month period with two of the three segments showing improvement. Net Income from Investment Activities (43.0% of Net Income) declined 26.0% on account of increased volatility in global financial markets caused by inflation, increasing interest rates and economic spill-overs from the war in Ukraine.
Net Income from Insurance Activities (51.3% of Net Income) expanded 63.2% in the period under review. Gross Written Premiums advanced 2.2% ($81.6M) while Net Written Premiums climbed 5.3% ($118.5M). GHL’s Life, Health and Pensions segment recorded an 63.8% increase in Operating Profit driven by increased premiums and lower underwriting expenses. The segment also benefitted from favourable reserve movements, capitalizing on investment and expense management opportunities. Net Income from Brokerage Activities (5.7% of Net Income) increased 6.0% during the period to $76.3M.
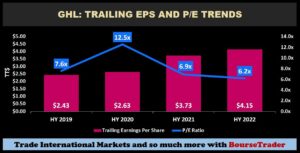
GHL’s Trailing Earnings Per Share increased from $3.73 in HY 2021 to $4.15 in HY 2022. The Group’s Price-to-Earnings (P/E) multiple fell from 6.9 times to 6.2 times in the current period, relative to its historical average P/E valuation during 2017-2019 of 8.5 times.
The Bourse View
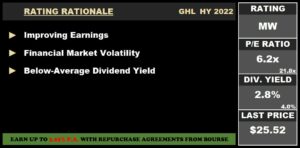
GHL is currently priced at $25.52 and trades at a price to earnings ratio of 6.2 times relative to a Non-Banking Financial Sector average of 21.8 times. GHL’s trailing dividend yield is currently 2.8% relative to a sector average of 4.0%. The company announced an interim dividend of $0.39, to be paid on August 29th 2022 to shareholders on record by August 12th 2022.
The Group benefitted from increased Net Written Premiums and higher investment income led by increased investment portfolios and income earned. Financial markets, though still uncertain may continue to affect the performance of GHL’s Investing Activities in the short to medium term. On the basis of increased earnings but tempered by lingering financial market uncertainty, Bourse maintains a MARKETWEIGHT rating on GHL.
“This document has been prepared by Bourse Securities Limited, (“Bourse”), for information purposes only. The production of this publication is not to in any way establish an offer or solicit for the subscription, purchase or sale of any of the securities stated herein to US persons or to contradict any laws of jurisdictions which would interpret our research to be an offer. Any trade in securities recommended herein is done subject to the fact that Bourse, its subsidiaries and/or affiliates have or may have specific or potential conflicts of interest in respect of the security or the issuer of the security, including those arising from (i) trading or dealing in certain securities and acting as an investment advisor; (ii) holding of securities of the issuer as beneficial owner; (iii) having benefitted, benefitting or to benefit from compensation arrangements; (iv) acting as underwriter in any distribution of securities of the issuer in the three years immediately preceding this document; or (v) having direct or indirect financial or other interest in the security or the issuer of the security. Investors are advised accordingly. Neither Bourse nor any of its subsidiaries, affiliates directors, officers, employees, representatives or agents, accepts any liability whatsoever for any direct, indirect or consequential losses arising from the use of this document or its contents or reliance on the information contained herein. Bourse does not guarantee the accuracy or completeness of the information in this document, which may have been obtained from or is based upon trade and statistical services or other third party sources. The information in this document is not intended to predict actual results and no assurances are given with respect thereto.”
