HIGHLIGHTS
SBTT Q1 2022
- Earnings: EPS 27.1% higher, from $0.83 to $1.05
- Performance Highlights:
- Higher Revenues
- Reduced Impairment Losses
- Outlook:
- Economic Uncertainty
- Rating: Assigned at MARKETWEIGHT.
WCO FY 2021
- Earnings: Earnings Per Share of $1.50, a decline from Earnings Per Share of $1.62
- Performance Drivers:
- Reduced Revenue
- Lower Margins
- Outlook:
- Economic Reopening
- Rating: Assigned at MARKETWEIGHT.
This week, we at Bourse review the financial performance of the Canadian-owned Banking giant, Scotiabank Trinidad and Tobago Limited (SBTT), for the first quarter ended January 31st, 2022. We also review the performance of the West Indian Tobacco Company Limited (WCO) for the financial year ended December 31st, 2021.SBTT advanced on account of higher revenues, lower Impairment Losses and Non-Interest Expenses, whereas WCO recorded lower revenues and margins linked to Covid-19 induced economic challenges. Could SBTT continue to build on its positive earnings momentum? Will the reopening of entertainment channels drive the performance of WCO throughout the course of 2022? We discuss below.
Scotiabank Trinidad and Tobago Limited (SBTT)
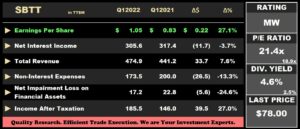
Scotiabank Trinidad and Tobago Limited (SBTT) reported an Earnings per Share (EPS) of $1.05 for the three-month period ended 31st January, 2022 (Q12022), a 27.1% increase versus EPS of $0.83 in the prior period. Cumulatively, SBTT recorded $474.9M in Total Revenue for Q12022, a 7.6% increase compared to a prior $441.2M. Non-Interest Expenses shifted 13.3% lower to $173.5M in Q12022, as a result of the Bank’s implementation of cost management initiatives. SBTT recorded a 24.6% decrease in Net Impairment Loss on Financial Assets, amounting to $17.2M (Q12021: $22.8M). Income before Taxation (PBT) stood at $284.2M, 30.2% higher relative to $218.4M recorded in Q12021. The Taxation expense rate moved from 33.1% to 34.8% in the period under review. Overall, SBTT reported a Profit for the Period of $185.5M, up 27.0% compared to $146.0M in Q12021.
Revenue Higher
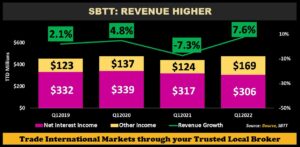
SBTT’s Total Revenue recovered in Q1 2022 (up 7.6%) after falling in the prior comparable quarter. Net Interest Income, the Group’s largest revenue contributor (Q1 2022: 64.4%) fell by 3.7% to TT$ 306M, as a result of the continued low interest rate environment, offset partially by an increase in the loan portfolio. Meanwhile, Other Income (35.6% of Total Revenue) recorded a 36.7% increase as the Group saw continued recovery in some of their core banking activity lines.
The Bank largest operational segment by revenue, Retail Corporate & Commercial Banking (90.6% of Total Revenue) and its Asset Management segment expanded 7.7% and 114.3% respectively, year-on-year. Its Insurance Services segment increased by a less outstanding 1.7% in Q12022.
Marginal Loan Growth, Impairment Losses Decline
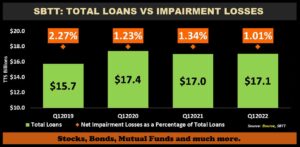
SBTT recorded a marginal increase of 0.2% of its Total Loan Portfolio from $17.0M in Q12021 to $17.1M in Q12022, as continued recovery in economic activity stabilized loan demand. Loans to Customers (95.6% of Total Loans), the Bank’s largest and interest earning asset increased 0.6% or by $98.3M year on year, whereas, Loans and advances to banks and related companies fell 8.3%.
Net Impairment losses on financial assets fell to $17.2M from $22.8M in the prior period, resulting in decrease in the ratio of Net Impairment Losses to Total loans to 1.01% from 1.34% in Q12021. The Group’s credit quality continues to show improvement as demonstrated by the ratio of non-performing loans as a percentage of gross loans improving from 2.35% to 1.90% in Q12022.
The Bourse View
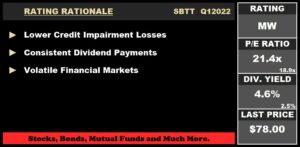
SBTT is currently priced at $78.00, up 13.9% year-to date. The stock trades at a Trailing Price to Earnings ratio of 21.4 times, above the Banking Sector average of 18.9 times. The stock also offers investors a Trailing Dividend Yield of 4.6%, above the sector average of 2.5%. The Group declared an interim dividend payment of $0.65 per share to be paid on April 12th, 2022. SBTT’s dividend yields continue to remain healthy, reaffirming its commitment to maximize shareholders’ return in the form of dividend payments (pay-out ratio: 61.9% in Q1 2022) as well as capital appreciation. On the basis of consistent dividend payments, but tempered by lingering economic challenges, Bourse assigns a MARKETWEIGHT rating on SBTT.
The West Indian Tobacco Company Limited (WCO)

The West Indian Tobacco Company Limited (WCO) reported Earnings Per Share of $1.50 for the financial year ended December 31st 2021 (FY2021), a 7.4% decline from $1.62 reported in the prior comparable period. Revenue fell 5.3% Year on Year (YoY) from $899.9M to $852.3M, followed by a 1.7% decline in Cost of Sales. Consequently, Gross profit fell to $644.8M, 6.4% lower compared to $688.9M reported in FY2020. Declines in distribution costs and administrative expenses were offset by a 56.4% ($8.6M) increase in Other Operating Expenses to bring Total Expenses to $107.4M, down 5.6% YoY. Operating Profit contracted 8.5%, from $587.2M in FY2020 to $537.4M in FY2021. WCO reported a Net Finance Expense of $0.2M, relative to Net Finance Income of $0.9M in FY2020. Profit Before Tax fell 8.6% to $537.2M from $588.1M in FY2020. Overall, Profit After Taxation (PAT) declined 7.6% to close at $379.0M in FY2021 from a prior $410.0M.
Revenue Challenges Persist
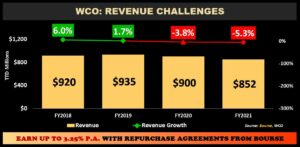
WCO’s performance mirrored economic trends caused by the Covid-19 pandemic in 2021. Revenues fell 5.3% to $852M in FY2021, reflecting the impact of reduced business and economic activity, severely disrupted market dynamics and evolving consumer trends. Despite the closure of entertainment channels during the period, the company was able to benefit from increased demand from its distributors as supermarket sales heightened. According to WCO, the company accelerated the transformation of its brand portfolio in an effort to respond to changing market dynamics and maintain its position as the premium supply source for cigarettes for Domestic and Caribbean Markets.
Margins Lower
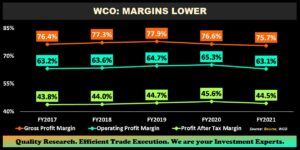
WCO’s Operating Margin deteriorated from 65.3% in FY2020 to 63.1% in FY2021, following a 5.6% ($5.7M) increase in overheads stemming from increased Brand Support Expenditure and IT Shared Service costs. Consequently, Profit After Tax Margin fell to 44.5% in FY2021 relative to a prior 45.6%. Gross Profit Margins remained fairly stable despite revenue declines, standing at 75.7% in FY2021. In its annual report, the company stated that its overall equipment effectiveness increased from 50.1% in 2020 to 51.4% in 2021, while tobacco waste declined from 9.4% in 2020 to 8.7% in 2021. These improvements in operational efficiencies may translate into improved margins in subsequent periods.
Dividends Lower
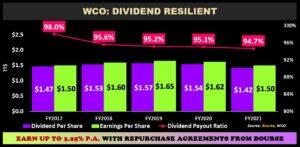
Declining earnings have impacted dividends to WCO shareholders, with the Company’s dividend falling by $0.12 over the prior comparable period to $1.42 for FY2021 (FY2020: $1.54 per share). Despite the decrease in dividends, WCO currently offers the highest trailing 12-month dividend yield (5.9%) on the Trinidad and Tobago Stock Exchange.
The Bourse View

At a current price of $24.00, WCO trades at a P/E of 16.0 times, below the Manufacturing Sector average of 35.2 times. The company announced a proposed final dividend of $0.70 to be paid on May 12th 2022. The stock offers investors a trailing dividend yield of 5.9%, above the sector average of 3.6%. Despite declining margins over the period, WCO’s performance could be poised to recover as traditional distribution channels – including bars and other entertainment channels – are allowed to reopen. Moreover, the launch of its ultra-low-price Rothmans White brand may assist the company in regaining market share lost to lower cost substitutes and illicit products. On the basis of strong pricing power, attractive valuations and stable dividends, but tempered by recent illicit goods and substitute product competition, Bourse assigns a MARKETWEIGHT rating on WCO.
“This document has been prepared by Bourse Securities Limited, (“Bourse”), for information purposes only. The production of this publication is not to in any way establish an offer or solicit for the subscription, purchase or sale of any of the securities stated herein to US persons or to contradict any laws of jurisdictions which would interpret our research to be an offer. Any trade in securities recommended herein is done subject to the fact that Bourse, its subsidiaries and/or affiliates have or may have specific or potential conflicts of interest in respect of the security or the issuer of the security, including those arising from (i) trading or dealing in certain securities and acting as an investment advisor; (ii) holding of securities of the issuer as beneficial owner; (iii) having benefitted, benefitting or to benefit from compensation arrangements; (iv) acting as underwriter in any distribution of securities of the issuer in the three years immediately preceding this document; or (v) having direct or indirect financial or other interest in the security or the issuer of the security. Investors are advised accordingly. Neither Bourse nor any of its subsidiaries, affiliates directors, officers, employees, representatives or agents, accepts any liability whatsoever for any direct, indirect or consequential losses arising from the use of this document or its contents or reliance on the information contained herein. Bourse does not guarantee the accuracy or completeness of the information in this document, which may have been obtained from or is based upon trade and statistical services or other third party sources. The information in this document is not intended to predict actual results and no assurances are given with respect thereto.”
