BOURSE SECURITIES LIMITED
September 19th, 2016
Pre-Budget Analysis: Economic Recap
This week, we at Bourse present the first of a two-part series focused on key economic factors to be considered in anticipation of the FY 2016/2017 National Budget, to be delivered on September 30th 2016. We take a closer look today at trends in real Gross Domestic Product (GDP) growth, energy sector activity, currency movement and borrowing activity.
Real GDP
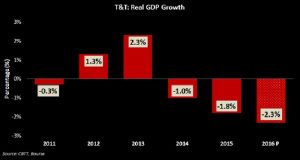
After contracting 2.1% in 2015, T&T’s GDP is forecasted to decline by 2.3% in 2016, while the International Monetary Fund (IMF) projects a recovery of 2.3% in 2017.
The latest economic data shows that the T&T economy contracted 5.2% (year-on-year) in the first quarter of 2016, driven by declines in the energy sector (9.1%) and the non-energy sector (2.8%).
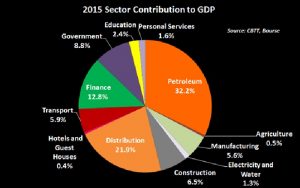
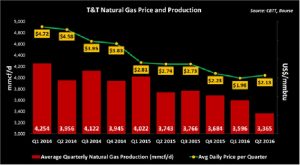
The petroleum sector, the largest single contributor to GDP, has accounted for 38.7% of GDP on average over the past five years. Contributing 32% in 2015, the sector remains afflicted by lower energy prices and production. Oil production has declined to 66,000 barrels per day as at July 2016 as opposed to 78,000 in 2015. Natural gas production has also declined from 3.83 bcfd in 2015 to the current 3.21 bcfd.
The slowing of the economy’s dominant energy sector has had far-reaching effects for the wider local economic landscape, trickling down to the non-energy sector. Marked declines in cement and motor vehicles sales in 2016 point to lower construction activity and waning demand for consumer durables.
Revenue pressures
Over the past five fiscal periods, Government revenues averaged $52.5 billion, with tax revenues accounting for approximately 86% of total revenues. While a four year average since Fiscal 2011 showed oil taxes accounting for approximately 41% of tax revenues, income from oil taxes for Fiscal 2015 accounted for just 29% or $11.9B of total tax take. In addition to waning production, the root of the decline in oil taxes traces back to the Supplemental Petroleum Tax (SPT)(2010) under the Petroleum Tax Act, which required the submission of zero percent (0%) taxes effective 2010, should oil prices fall below US$50 per barrel. For fiscal 2015 oil closed at $US45.09bbl.
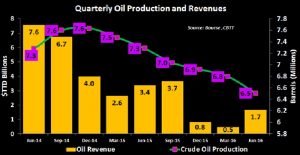
This fall in oil taxes, due to the precipitous 50.5% decline in oil prices during FY2015 (US$91.16bbl 30/09/2014 to US$45.09 30/09/2015), was accompanied by a decline in direct oil revenues earned by the Government. In FY2015, the Government earned $13.7B representing 25% of total revenues, a considerable decline when compared to the four year average contribution of 40%. In 2016, declining production volumes surpressed revenues, as evidenced by Q2 production volumes of 6.5M barrels, when compared to the 5 year average Q2 production of 7.6M barrels.
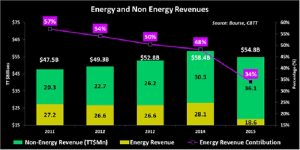
On a larger scale, the contribution of revenues from the energy sector has declined considerably over the past 5 years. Despite a relatively gradual upward trend in total revenues, energy revenue has fallen 31.6% since FY 2011, contributing $18.6B or 34% to total revenues in FY 2015 as opposed to $27.2B (57% of total revenues) in FY 2011. The revenues earned from non-energy sources are also projected to fall as the non-energy GDP is expected to decline 2.5% (yoy) according to the CBTT. Despite the Government’s goal of collecting a further $4 billion in VAT revenues since the effect of the new VAT regime in February 1st 2016, collections within the five month period to June 2016 have amounted to $1.99 billion, an amount 20% less than the comparable period’s five year average of $2.49 billion. The new VAT regime encompassed the reduction of the VAT rate from the previous 15% to 12.5%, with VAT being imposed on 7,000 previously zero rated items.
Expenditure
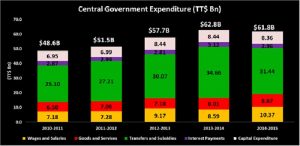
While it is projected that the country’s expenditure will reach as high as $59 billion during Fiscal 2016, the Government has set out to reduce costs through various mechanisms including fuel subsidy reduction and cuts to the GATE program. Expenditure for Fiscal 2016 has already amounted to $36.5 billion for the nine month period ended 30th June 2016, in line with the five year average of comparable periods of $36.9 billion.
Historically, the ratios of the various expenses have remained relatively stable, with Wages and Salaries accounting for roughly 15% of expenses, Goods and Services 13%, Transfers and Subsidies 53%, interest payments 5% and CAPEX 14%. Recent data released for FY 2016 thus far indicated some shifts to the expenditure composition. There has been a sharp fall of 51% in Capital expenditure for the period which totalled $1.8 billion, in comparison to the planned $7 billion outlined for the fiscal year. As a result, this expense now accounts for 5% of total expenses while Transfers and Subsidies and Wages and Salaries account for 57% and 19% of expenses respectively.
TTD Currency Depreciation
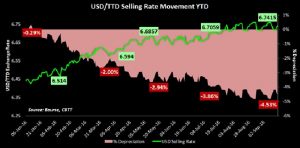
Having started the year at $6.4493, the USD/TTD exchange rate has depreciated 4.5% for the year thus far, reaching $6.7415 on September 16th 2016. Lower foreign exchange inflows from the energy sector and a continuing demand-supply imbalance in the USD market will likely place some strain on the CBTT’s intervention efforts to manage the TT dollar’s strength. After injecting approximately $2.6 billion into system in 2015 (the highest in the past five years), the Central Bank sold just $1.06 billion to authorized dealers between January and August 2016. Against this backdrop, it would appear that the trend of TT dollar depreciation will remain intact.
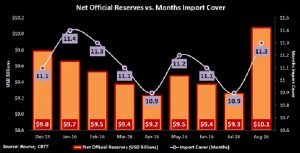
T&T Net Official Reserves stood at US$10.1 billion in August 2016, equating to 11.3 months import cover, up from US$9.3 billion in July 2016. This increase in reserves coincided with the issuance of a US$1 billion bond by the Government of the Republic of Trinidad & Tobago in August 2016.
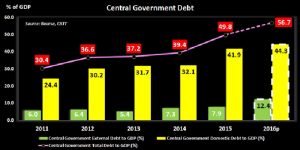
Debt to GDP: Borrowing Increases
Total external debt has increased, with outstanding external debt amounting to US$ 2.1B in FY 2015, the equivalent of 7.9% of GDP and 19.8% of exports. With the recent issue of the 4.5% US$1 billion bond due August 4th 2026, the country’s external debt to GDP is expected to climb to 12.4%. Despite new external borrowing, T&T’s debt to GDP ratio compares favourably to the average external debt positions of emerging market and developing economies of 28.8% of GDP in 2015 as noted by the International Monetary Fund (IMF). Furthermore, there was an addition of domestic borrowings of TT$3.0B, comprised of a TT$1.0B 4.5% bond due May 16th 2028 and, a TT$2.0B 4.5% bond underwritten by Republic bank and issued on June 29th 2016.
These borrowings are estimated to have raised the total debt to GDP ratio from 49.8% to 56.7% (using 2015 GDP figures). This is below the total debt to GDP ratio of regional partners with twelve of twenty Caribbean economies having a ratio over 60% and four economies reaching ratios of over 80% such as Jamaica (122.5%) and Barbados (156.6%). Even with the borrowing already undertaken, there remains some room to add further debt based on the self-imposed 65% guideline mentioned by the honourable Minister of Finance equating to roughly TT$11.2 billion in additional borrowing (based on 2015 GDP levels).
Was the FY15/16 Fiscal Gap Closed?
Revised projections of revenue ($52.7 billion) and expenditure ($59 billion) at the mid-year review placed the fiscal deficit at $6.7 billion or roughly 4% of GDP. To close the gap, the Honourable Minister of Finance alluded to several one-off sources of income, namely the sale of assets, drawdowns from the HSF, dividends from NGC, proceeds from the TTNGL IPO and the repayment of loans given to TGU.
Having received already received $1.5 billion in proceeds from the TTNGL IPO, other measures such as the sale of CLICO’s assets (specifically its shares in Angostura Holdings Limited, CL World Brands, Home Construction Limited and Methanol Holdings International Limited) may not have materialized to the extent of government’s expectations.
Notwithstanding this, the government’s withdrawal of US$375 million ($2.5 billion) from the Heritage and Stabilization Fund in June 2016, combined with approximately $9.7 billion raised via domestic ($3 billion) and international debt markets (US$1 billion or $6.7 billion) over the past fiscal year, should have proven to be sufficient to meet fiscal obligations, notwithstanding any unexpected revenue shortfalls for fiscal 2015/2016.
Looking ahead, the continued twofold decline in production and price of oil and natural gas, coupled with some ‘stickiness’ in terms of expenditure adjustment, could lead to yet another deficit budget in fiscal 2016/2017.
In the second part of our pre-budget analysis, we will evaluate the possible challenges for the upcoming fiscal year and several measures that may be implemented by the government to minimize the deficit.
For the detailed report and access to our previous articles, please visit our website at: http://www.remotestores.com/content/
For more information on these and other investment themes, please contact Bourse Securities Limited, at 628-9100 or email us at invest@boursefinancial.com.
“This document has been prepared by Bourse Securities Limited, (“Bourse”), for information purposes only. The production of this publication is not to in any way establish an offer or solicit for the subscription, purchase or sale of any of the securities stated herein to US persons or to contradict any laws of jurisdictions which would interpret our research to be an offer. Any trade in securities recommended herein is done subject to the fact that Bourse, its subsidiaries and/or affiliates have or may have specific or potential conflicts of interest in respect of the security or the issuer of the security, including those arising from (i) trading or dealing in certain securities and acting as an investment advisor; (ii) holding of securities of the issuer as beneficial owner; (iii) having benefitted, benefitting or to benefit from compensation arrangements; (iv) acting as underwriter in any distribution of securities of the issuer in the three years immediately preceding this document; or (v) having direct or indirect financial or other interest in the security or the issuer of the security. Investors are advised accordingly. Neither Bourse nor any of its subsidiaries, affiliates directors, officers, employees, representatives or agents, accepts any liability whatsoever for any direct, indirect or consequential losses arising from the use of this document or its contents or reliance on the information contained herein. Bourse does not guarantee the accuracy or completeness of the information in this document, which may have been obtained from or is based upon trade and statistical services or other third party sources. The information in this document is not intended to predict actual results and no assurances are given with respect thereto.”