HIGHLIGHTS
WCO 9M2024
- Earnings: Earnings Per Share fell 27.1% to $0.43
- Performance Drivers:
- Reduced Revenues
- Lower Margins
- Outlook:
- New Product Offering
- Rating: Maintained as MARKETWEIGHT
PHL 9M2024
- Earnings: Earnings Per Share of TT$0.78, 15.5% higher from EPS of TT$0.68
- Performance Drivers:
- Increased revenues
- Improved Margins
- Outlook:
- Continued new store openings
- Rating: Maintained as OVERWEIGHT
This week, we at Bourse review the financial performance of the West Indian Tobacco Company Limited (WCO) and Prestige Holdings Limited (PHL) for its nine months ended September 30th, 2024, and August 31st, 2024, respectively. While WCO’s performance was constrained by reduced revenues and lower margins, PHL benefitted from higher revenues and improved margins. What might investors expect in the months ahead? We discuss below.
The West Indian Tobacco Company Limited (WCO)
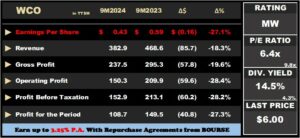
The West Indian Tobacco Company Limited (WCO) reported an Earnings Per Share (EPS) of $0.43 for the nine-month period ended September 30th, 2024 (9M2024), a 27.1% decline from the $0.59 reported in the prior comparable period.
Revenue fell 18.3% Year on Year (YoY) from $468.6M to $382.9M. Cost of Sales was considerably lower by 16.1%, falling to $145.3M from $173.2M in 9M2023. Gross Profit fell to $237.5M, 19.6% lower compared to $295.3M reported in 9M2023. Distribution costs advanced by $9.8M (124.5% higher YoY) and administrative expenses rose by 5.1% in 9M2024, offset by a 42.6% decline in other operating expenses. This resulted in an Operating Profit of $150.3M in 9M2024 or a 28.4% decline relative to the same period last year. Profit Before Tax (PBT) declined by 28.2%, dropping from $213.1M to $152.9M in 9M2024, which led to a decrease in the PBT margin from 45.5% to 39.9%. Taxation Expense for the period contracted 30.4% to $44.2M. Overall, WCO reported a Profit for the Period of $108.7M in 9M2024, down 27.3% from $149.5M reported in 9M2023.
Revenue Lower
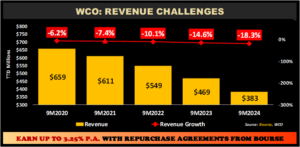
Despite a rise in export revenues, WCO’s total revenue in 9M2024 contracted to $383M, marking its lowest level in the past five years. This is mainly attributable to a fall in domestic revenues by 17.5% YoY. The rate of decline has accelerated, with revenue growth dropping by -6.2% in 9M2020 and worsening to -18.3% in 9M2024.
Additionally, revenue from Caricom and non-Caricom markets decreased 21.3% to $76.3M in the current review period. WCO still continues to face market challenges largely influenced by changing consumer preferences characterized by lower demand and a growing appetite for lower-priced products. According to the Group, its new vaping product, ‘Vuse’ achieved positive returns and would likely support revenue growth in the quarters to come.
Margins Pressured
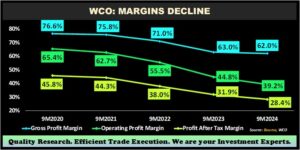
WCO’s profitability margins continued to decline relative to prior nine-month periods. The Group’s Gross Profit Margin fell in the current period to 62.0% from 63.0% in 9M2024, following a substantial decrease in revenue due to challenges in the local market. Operating Margin saw the largest deterioration as distribution costs and administrative expenses increased, declining from 44.8% to 39.2% in 9M2024. Consequently, Profit After Tax Margin fell to 28.4% in 9M2024 relative to a prior 31.9%.
The Bourse View
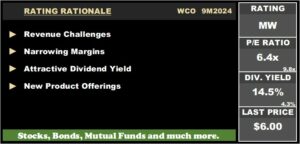
WCO currently trades at a market price of $6.00, down 32.6% year-to-date. The Group trades at a trailing P/E of 6.4 times, which includes the 4Q2023 EPS generated of $0.51. This may be somewhat challenging for WCO to achieve in 4Q2024 (October-December) considering its reported EPS of $0.11 in 3rd quarter 2024 (July- September). Its trailing P/E is currently below the Manufacturing I & II sector average of 9.8 times.
The company announced an interim dividend of TT$0.15 to be paid on November 27th, 2024 to shareholders on record on November 8th, 2024. The stock offers investors a trailing dividend yield of 14.5%, above the sector average of 4.3%.
Investors remain watchful for concrete signs of revenue and margin stabilization in the coming quarters, which will be essential for any potential turnaround in the stock’s performance. On the basis of relatively attractive valuations and dividend yields, tempered by continued revenue and margin pressures, Bourse maintains a MARKETWEIGHT rating on WCO.
Prestige Holdings Limited (PHL)
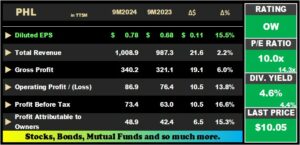
Prestige Holdings Limited (PHL) reported a Diluted Earnings per Share (EPS) of $0.78 for the nine-month period ended August 31st, 2024 (9M2024), an increase of 15.5% from $0.68 reported in 9M2023.
Notably, Total Revenue grew from a prior $987.3M in 9M2023 to $1.01M in the current period, an increase of 2.2%. Gross Profit jumped 6.0% to $340.2M in 9M2024, despite a 0.4% increase in Cost of sales to $668.7M. Operating Expenses and Administrative Expenses grew 3.8% and 2.6%, respectively. Other income fell by 14.5% to $1.1M. Resultantly, PHL’s operating profit increased 13.8% year-on-year from $76.4M to $86.9M in 9M2024. Finance Costs marginally increased 0.4% to $13.5M. PHL’s Profit before Income Tax increased 16.6% year on year, from $62.9M in the prior period, relative to $73.4M in the current period. The Group’s effective tax rate was maintained at 33% year on year. Overall, PHL’s Profit Attributable to Owners of the Parent grew 15.3%, from $42.4M in 9M2023 to approximately $49.0M in the current review period.
Revenues Improved
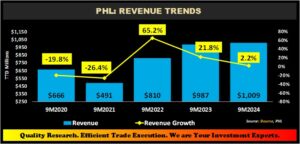
PHL’s overall revenue climbed 2.2% year on year, continuing their positive momentum, driven mostly by several factors, namely (i) increased product innovation across all brands and (ii) remodelling and relocation of existing stores. Looking ahead, the restaurant management company disclosed that (8) existing stores were remodelled/relocated as of 9M2024, with an additional five (5) remodels scheduled for completion by the end of fiscal year end 2024.
Margins Higher
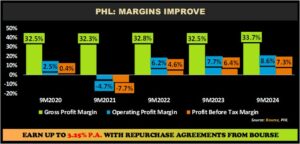
For the first nine months (9M2024), PHL’s profitability margins generally improved, with Gross Profit Margin expanding from 32.5% in 9M2023 to 33.7% in 9M2024. Operating Profit Margin grew from 7.7% to 8.6% in 9M2024, despite increases in both operating and administrative expenses. Profit Before Tax (PBT) margin, widened to 7.3%, compared to a prior 6.4%.
PHL’s efforts to drive cost efficiency across all brands are most likely contributing to the improvements in Operating and PBT margins, which have continued to trend upwards for the last three consecutive reporting periods.
The Bourse View
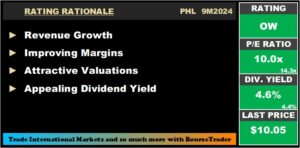
PHL trades at a current market price of $10.05, up 8.1% year-to-date. The stock trades at a trailing 12-month P/E ratio of 10.0 times, below the trading sector’s average of 14.3 times. The stock offers investors a trailing dividend yield of 4.6%, above the sector average of 4.4%.
PHL remains well-positioned in the restaurant industry, both locally and regionally, with a resilient and appealing brand portfolio as well as expanding markets. On the basis of strong revenues, continued new store openings and fairly attractive valuations, Bourse maintains an OVERWEIGHT rating on PHL.
“This document has been prepared by Bourse Securities Limited, (“Bourse”), for information purposes only. The production of this publication is not to in any way establish an offer or solicit for the subscription, purchase or sale of any of the securities stated herein to US persons or to contradict any laws of jurisdictions which would interpret our research to be an offer. Any trade in securities recommended herein is done subject to the fact that Bourse, its subsidiaries and/or affiliates have or may have specific or potential conflicts of interest in respect of the security or the issuer of the security, including those arising from (i) trading or dealing in certain securities and acting as an investment advisor; (ii) holding of securities of the issuer as beneficial owner; (iii) having benefitted, benefitting or to benefit from compensation arrangements; (iv) acting as underwriter in any distribution of securities of the issuer in the three years immediately preceding this document; or (v) having direct or indirect financial or other interest in the security or the issuer of the security. Investors are advised accordingly. Neither Bourse nor any of its subsidiaries, affiliates directors, officers, employees, representatives or agents, accepts any liability whatsoever for any direct, indirect or consequential losses arising from the use of this document or its contents or reliance on the information contained herein. Bourse does not guarantee the accuracy or completeness of the information in this document, which may have been obtained from or is based upon trade and statistical services or other third-party sources. The information in this document is not intended to predict actual results and no assurances are given with respect thereto.”

