HIGHLIGHTS
TCL FY2023
- Earnings: Earnings Per Share increased 855.9% from a Loss Per Share of $0.04 to $0.29
- Performance Drivers:
- Revenue Growth
- Improved Margins
- Outlook:
- Cost management initiatives
- Rating: Maintained at MARKETWEIGHT
NFM FY2023
- Earnings: Earnings Per Share 412.5% higher, from $0.058 to $0.30
- Performance Drivers:
- Revenue Growth
- Higher Finance Costs
- Improved Margins
- Outlook:
- Uncertain economic conditions
- Rating: Maintained at MARKETWEIGHT
This week, we at Bourse review the financial performance of Trinidad Cement Limited (TCL) and National Flour Mills Limited (NFM) for their respective fiscal years ended December 31st, 2023. TCL reported increased revenue growth and improved profitability margins. Similarly, NFM reported increased profits amidst uncertain global economic conditions. Will both companies continue their positive momentum in the upcoming fiscal quarters? We discuss below.
Trinidad Cement Limited (TCL)
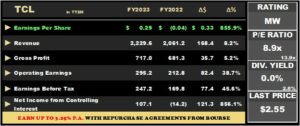
For the full year ended December 31st, 2023, Trinidad Cement Limited (TCL) reported an Earnings Per Share (EPS) of $0.29, up 855.9% from a Loss per Share of $0.04 in the prior comparable period.
Revenue advanced 8.2% to $2.23B from a previous $2.06B in FY2022, boosted by increased cement sale volumes across all operating jurisdictions. Despite a 9.6% uptick in cost of sales, Gross Profit increased 5.2% from $681.3M to $717.0M. Operating Earnings Before Other Income fell to $384.4M from a prior $386.4M. Other Expenses fell 45.0%, to $104.4M relative to $189.6M reported in the prior period. Consequently, Operating Earnings increased 38.7% to $295.2M relative to $212.8M in the prior period. Financial Expenses were 23.8% higher, from $44.2M in FY2022 to $54.8M in the current period. Despite a decrease in Taxation expense by 31.2%, Earnings Before Tax amounted to $247.2M, 45.6% greater than the prior comparable period. Resultantly, Net Income for the period closed at $170.2M, while Net Income attributable to Controlling Interest swung from a loss of $14.2M to a profit of $107.1M reported in the current period.
Revenue Climbs
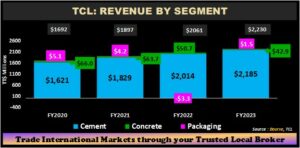
TCL’s revenue continued to trend upwards, reflecting consistent improvement in the last four reporting periods, starting with a marginal decrease in the heavily COVID-affected FY2020. Total revenue advanced 8.2% from $2.06B (FY2022) to $2.23B in FY2023, impacted by (i) higher sales volume across the group and (ii) the positive impact of cement price increases.
Cement, TCL’s largest segment (98.0% of Revenue) rose 8.5% to $2.19B from a prior $2.01B. Concrete, accounting for 1.9% of Total Revenue, fell 15.3% YoY to $42.9M, while third-party revenue Packaging, shifted from a deficit of $3.3M to $1.5M in the current period.
Margins Improve
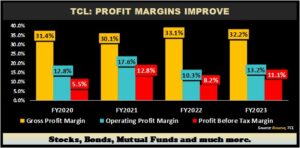
The company’s profitability margins rebounded relative to the prior comparable period. Gross Profit Margin fell from 33.1% (FY2022) to 32.2% in FY2023. Operating Profit Margin grew from 10.3% in FY2022 to 13.2% in FY2023, while Profit Before Tax Margin increased to 11.1% from a prior 8.2%. TCL reinforced the importance of improving efficiency and containing increases in input costs in maintaining profitability.
TCL also reported the reduction of carbon emissions by increasing heat efficiencies and utilizing alternative fuels, such as waste oils, in Jamaica and Trinidad and Tobago. The Group’s continued emphasis on sustainability developments and adherence to its Cemex “Future in Action” programme should improve investors’ confidence in the viability of its business model.
Price increases, new product offerings
Effective February 19th, 2024 – the group would have increased cement prices on average around 7.0%. Additionally, on April 5th, 2024, the Group launched its new plastering mix, ‘Plasta Masta’ – the ideal mortar mix in an effort to improve efficiency. The price increase should support revenue growth and/or margin preservation in upcoming fiscal periods.
The Bourse View

At a current price of $2.55, TCL trades at a market to book ratio of 1.2 times and a trailing P/E ratio of 8.9 times, notably below the combined Manufacturing I & II Sectors’ Average of 13.9 times.
Despite a dynamic cost environment and economic uncertainty, the Group has managed to generate strong earnings growth while pursing credible environmental sustainability initiatives. On the basis of higher revenues, improved margins and increased cement prices, tempered by an absence of dividend income, Bourse maintains a MARKETWEIGHT rating on TCL.
National Flour Mills Limited (NFM)
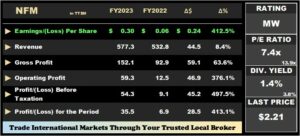
NFM reported Earnings per Share (EPS) of $0.30 for the financial year ended December 31st, 2023 (FY2023), up 412.5% higher relative to $0.06 reported in the prior comparable period (FY2022).
Notably, Revenue for the period grew 8.4% year-on-year (YoY) to $577.3M from a prior $532.8M. Cost of Sales fell by 3.3% to $425.3M from $439.9M, leading to a sizeable increase in Gross Profit of 63.6%, from $92.9M to $152.1M in FY2022. Selling and Distribution Expenses climbed 18.9%, year-on-year, similarly, Administrative Expenses climbed 10.5% to $52.1M, compared to the prior period. Other Operating Income grew marginally by 4.2% to $6.8M, relative to $6.6M a year earlier. Operating Profit was up 376.1%, from a prior $12.5M in FY2022 to $59.3M in FY2023. Finance Cost was 49.8% higher and amounted to $5.1M. Profit Before Tax (PBT) expanded by 497.5%, from a previous $9.1M to $54.3M. Taxation expense stood at $18.8M in the current period relative to $2.2M in FY2022. Overall, NFM’s Profit for the Period settled at $35.5M, 413.1% higher compared to $6.9M in FY2022.
Revenue Improves
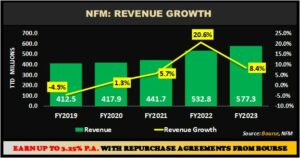
NFM’s revenue has progressively increased over the past five reporting periods. This comes despite NFM’s average 10% decrease in prices in July 2023. According to the Company, its strategic focus includes the establishment of a ‘footprint throughout the Caribbean and then extra-regionally’.
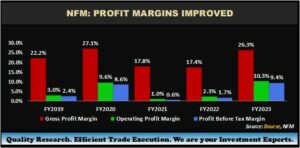
NFM’s profitability margins have shown marked improvement in FY2023, relative to historical levels. Gross Profit Margin improved from 17.4% in FY2022 to 26.3% in FY2023, while Operating Profit Margin was 8% higher, from 2.3% in FY2022 to 10.3% in FY2023. Profit before Tax expanded by 9.4% compared to 1.7%, a year earlier. It remains to be seen whether these margins can be preserved, given the traditional volatility of commodity markets.
The Bourse View
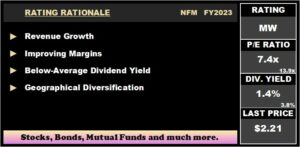
At a current price $2.21, NFM trades at a trailing P/E multiple of 7.4 times, below the Manufacturing Sector average of 13.9 times. The stock offers investors a trailing dividend yield of 1.4%, below the Manufacturing Sector average of 3.8%. The Board of Directors have proposed a final dividend payment of $0.10 in its latest earnings release.
On the basis of continued revenue, margins and earnings growth but tempered by a below-average dividend yield, Bourse maintains a MARKETWEIGHT rating on NFM.
“This document has been prepared by Bourse Securities Limited, (“Bourse”), for information purposes only. The production of this publication is not to in any way establish an offer or solicit for the subscription, purchase, or sale of any of the securities stated herein to US persons or to contradict any laws of jurisdictions which would interpret our research to be an offer. Any trade in securities recommended herein is done subject to the fact that Bourse, its subsidiaries and/or affiliates have or may have specific or potential conflicts of interest in respect of the security or the issuer of the security, including those arising from (i) trading or dealing in certain securities and acting as an investment advisor; (ii) holding of securities of the issuer as beneficial owner; (iii) having benefitted, benefitting or to benefit from compensation arrangements; (iv) acting as underwriter in any distribution of securities of the issuer in the three years immediately preceding this document; or (v) having direct or indirect financial or other interest in the security or the issuer of the security. Investors are advised accordingly. Neither Bourse nor any of its subsidiaries, affiliates directors, officers, employees, representatives, or agents, accepts any liability whatsoever for any direct, indirect, or consequential losses arising from the use of this document or its contents or reliance on the information contained herein. Bourse does not guarantee the accuracy or completeness of the information in this document, which may have been obtained from or is based upon trade and statistical services or other third-party sources. The information in this document is not intended to predict actual results and no assurances are given with respect thereto.”
