
HIGHLIGHTS
SBTT HY2025
- Earnings: Earnings Per Share 1.3% higher, from $1.84 to $1.93
- Performance Drivers:
- Modest Revenue Growth
- Higher Non-Interest Expenses
- Outlook:
- Increased Economic Activity
- Rating: Maintained at MARKETWEIGHT
CIBC HY2025
- Earnings: Earnings Per Share down 26.3% from TT$0.63 to TT$0.47
- Performance Drivers:
- Revenues Lower
- Higher Provision for Credit Losses
- Outlook:
- Increased Economic Activity
- Lower US Benchmark Interest Rates
- Rating: Maintained at MARKETWEIGHT
This week we at Bourse review the performance of locally listed Canadian banking giants, Scotiabank Trinidad and Tobago Limited (SBTT) and CIBC Caribbean Bank Limited (CIBC) for their respective six-months reporting periods ended April 30th, 2025 (HY2025). SBTT’s performance was supported by improved revenue growth, while CIBC was impacted by higher provision for credit losses. We discuss below.
Scotiabank Trinidad and Tobago Limited (SBTT)
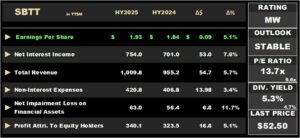
Scotiabank Trinidad and Tobago Limited (SBTT) reported Earnings per share (EPS) of $1.93 for the half year ended April 30th, 2025 (HY2025), a 5.1% increase compared to $1.84 in the prior comparable period.
Net Interest Income rose 7.6% to $754.0M, while Other Income marginally increased 0.7% from $254.2M in HY2024 to $255.9M in HY2025. Total Revenue for HY2025 came in at $1.0B, a 5.7% increase from the prior period. Non-Interest Expenses shifted 3.4% higher from $406.8M in HY2024 to $420.8M in HY2025, likely due to inflationary pressures. SBTT recorded a 11.7% rise in Net Impairment Loss on Financial Assets, amounting to $63.0M (HY2024: $56.3M). Profit before Taxation (PBT) grew to $526.1M, relative to $492.0M recorded in HY2024. Taxation rose 10.4% to $186.0M from $168.5M in the prior comparable period. Overall, SBTT reported a Profit Attributable to Equity Holders of $340.1M, up 5.1% compared to $323.5M in HY2024.
Improved Revenues
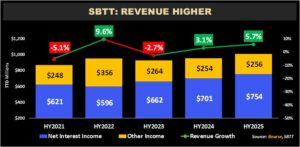
Net Interest Income, the Group’s largest revenue contributor (HY2025: 74.7%) rose by 7.6% year on year to $754M, driven by higher loan volumes across both the retail and commercial segments. Other Income (25.3% of Total Revenue) amounted to $256M in HY2025 (+0.7%), reflecting steady expansion in core business operations across all segments.
From an operating segment perspective, revenue growth was reported across all segments. The Bank’s largest operational segment by revenue, Retail Corporate & Commercial Banking (91.2% of Total Revenue) rose 4.6% year-on-year. The Asset management segment experienced a 56.6% increase from the prior comparable period. Its Insurance Services segment displayed growth of 13.3% YoY.
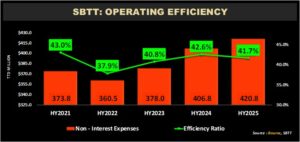
SBTT’s efficiency ratio improved to 41.7% in HY2025 from 42.6%, signaling enhanced operational efficiency. Non-interest expenses rose by $14.0M to $420.8M in HY2025. Looking ahead, the company’s ability to manage costs efficiently will be essential to sustaining future profitability.
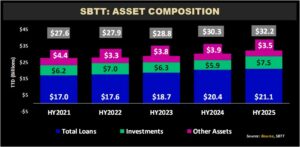
SBTT’s Total Assets rose 6.1% year-on-year, increasing from $30.3B in HY2024 to $32.2B in HY2025. Total Loans (65.6% of Total Assets) advanced 3.2% from $20.4B to $21.1B in HY2025, reflecting consistent growth across the past five (5) year reporting periods. The Investment portfolio (Securities and Treasury Bills) totaled $7.5B, growing 27.0% compared to the prior period, as the Group strategically deployed excess liquidity into investments.
The Bourse View
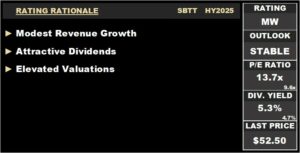
SBTT is currently priced at $52.50 and trades at a Trailing Price-to-Earnings ratio of 13.7 times, above the Banking Sector average of 9.6 times. The stock offers investors a healthy Trailing Dividend Yield of 5.3%, above the sector average of 4.7%. The Group declared an interim quarterly dividend payment of $0.70 per share to be paid to shareholders on July 11th, 2025.
SBTT’s steady dividend payments continue to present a compelling case for income-oriented investors, even as other banking sector stocks offer comparable and/or superior dividend yields. On the basis of improved performance and consistent dividend payments, tempered by elevated sector valuations, Bourse maintains a MARKETWEIGHT rating on SBTT.
CIBC Caribbean Bank Limited (CIBC)
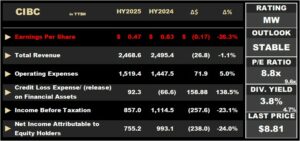
CIBC Caribbean Bank Limited (CIBC) reported an Earnings Per Share (EPS) of TT$0.47 for the six months ended April 30, 2025 (HY2025), 26.3% lower compared to TT$0.63 recorded in the prior period (HY2024).
Total Revenue amounted to TT$2.47B (HY2025), down 1.1% from the previous TT$2.50B (HY2024). Operating Expenses expanded 5.0% to TT$1.45B. Credit loss expense on financial assets was TT$92.3M in HY2025, in contrast with a release of TT$66.6M in HY2024, attributable to a non-recurring recovery in the Bahamas in the prior year. Income Before Tax (PBT) fell to TT$857.0M, a 23.1% reduction from TT$1.11B in the previous period. The Group’s Income Tax Expense climbed to TT$100.7M (+11.5%), influenced by the implementation of the global minimum corporate tax framework. Consequently, Net Income for the period dropped by 23.8% to TT$774.3M, compared to TT$1.02B in HY2024. According to the Group, Adjusted Net Income stood at TT$758.3M, down 28.7% from an adjusted TT$1.06B in the prior period, after excluding the one-off gain from a previously disclosed divestment. Overall, Net Income Attributable to Equity Holders declined by 24.0%, from TT$933.1M in HY2024 to TT$755.2M in HY2025.
Revenue Lowered
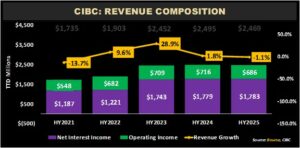
Total Revenue experienced a year-on-year (YoY) decline of 1.1%, moving from TT$2.50B in HY2024 to TT$2.47B in HY2025. Net Interest Income, which represents 72.2% of Total Revenue, improved marginally by 0.2% to TT$1,779B from TT$1,783B a year earlier. The Group’s loan portfolio advanced 8.1% from TT$45.2B in HY2024 to TT$48.8B in the current review period. Meanwhile, Operating Income (accounting for 27.8% of Total Revenue) declined by 4.2%, from TT$716M to TT$686M. According to CIBC, overall revenue performance was impacted by softer US interest rates, funding-related challenges, and unrealized losses from investments.
PBT by Segment
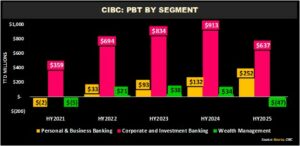
CIBC’s Profit Before Tax (PBT) drop by 23.1% Year over Year (YoY). The Bank’s largest contributor to PBT growth, Corporate and Investment Banking (74.3% of PBT), decreased 30.3% from TT$913M to TT$637M. Personal & Business Banking (PBB), contributing 29.4% to PBT, showed a significant improvement of 90.8% year-on-year, rising from TT$132M in HY2024 to TT$252M in the current period. The Wealth Management (WM) segment (5.5% of PBT) shifted from a profit of TT$34M in HY2024 to a loss of TT$47M in HY2025.
The Bourse View
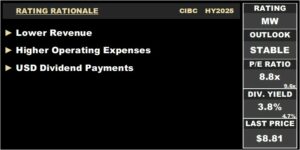
CIBC currently trades at a price of $8.81 at a trailing P/E ratio of 8.8 times, below the Banking Sector average of 9.6 times. The stock offers investors a trailing dividend yield of 3.8%, above the sector average of 4.7%. The Group announced an interim dividend of US$0.0125 (TT$0.08) per share payable to shareholders on July 18, 2025, on record as of June 26, 2025. Importantly, CIBC’s dividends are paid in US Dollars.
Investors should be aware that any additional cuts to U.S benchmark interest rates could place further pressure on topline performance. However, this impact may be partially offset by continued growth in loan volumes. On the basis of relatively fair P/E multiples and USD dividends, tempered by softening revenue and higher operating expenses, Bourse maintains an MARKETWEIGHT rating on CIBC.
This document has been prepared by Bourse Securities Limited, (“Bourse”), for information purposes only. The production of this publication is not to in any way establish an offer or solicit for the subscription, purchase or sale of any of the securities stated herein to US persons or to contradict any laws of jurisdictions which would interpret our research to be an offer. Any trade in securities recommended herein is done subject to the fact that Bourse, its subsidiaries and/or affiliates have or may have specific or potential conflicts of interest in respect of the security or the issuer of the security, including those arising from (i) trading or dealing in certain securities and acting as an investment advisor; (ii) holding of securities of the issuer as beneficial owner; (iii) having benefitted, benefitting or to benefit from compensation arrangements; (iv) acting as underwriter in any distribution of securities of the issuer in the three years immediately preceding this document; or (v) having direct or indirect financial or other interest in the security or the issuer of the security. Investors are advised accordingly. Neither Bourse nor any of its subsidiaries, affiliates directors, officers, employees, representatives or agents, accepts any liability whatsoever for any direct, indirect or consequential losses arising from the use of this document or its contents or reliance on the information contained herein. Bourse does not guarantee the accuracy or completeness of the information in this document, which may have been obtained from or is based upon trade and statistical services or other third-party sources. The information in this document is not intended to predict actual results and no assurances are given with respect thereto.”