PHL FY2023
- Earnings: Earnings Per Share increased 225.1% to $0.57
- Performance Drivers:
- Improved Revenues
- Lower Finance Costs
- Higher Margins
- Outlook:
- Cooling inflationary pressures
Rating: Assigned as MARKETWEIGHT
WCO FY2023
- Earnings: Earnings Per Share fell 30.7% to $1.04
- Performance Drivers:
- Reduced Revenues
- Lower Margins
- Outlook:
- Portfolio Transformation
- Rating: Assigned as MARKETWEIGHT
This week, we at Bourse review the financial performance of Prestige Holdings Limited for its financial year ended November 30th, 2022 and West Indian Tobacco Company Limited (WCO) for the year ended December 31st, 2022. While PHL benefitted from higher revenues as business operations normalized, WCO reported a decline in profitability impacted by company-specific revenue headwinds. As the economy regains momentum, what might investors expect in the months ahead? We discuss below
Prestige Holdings Limited (PHL)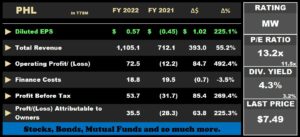
Prestige Holdings Limited (PHL) reported a Diluted Earnings per Share (EPS) of $0.57 for the financial year ended November 30th 2022 (FY2022), a dramatic turnaround from a loss per share of $0.45 recorded in FY2021. Revenue increased 55.2% from a previous $712.1M in FY 2021 to $1105.1M in FY2022. Despite a 54.8% increase in cost of sales, Gross Profit rose 56.0% from the prior period to $360.7M. Other Operating Expenses and Administrative expenses increased 19.1% and 17.2% respectively. Other income increased 48.0% to $2.3M. Resultantly, PHL reported a substantial Operating Profit of $72.5M relative to a previous Operating Loss of $12.2M. Finance Costs fell 3.5% to stand at $18.8M. The Group recorded a Profit Before Tax (PBT) of $53.7M, relative to the Loss Before Tax of $31.7M recorded in FY2021. Overall, PHL reported Profit Attributable to Owners of the Parent Company of $35.5M, relative to a Loss to Owners of $28.3M in the prior comparable period.
Revenues Higher
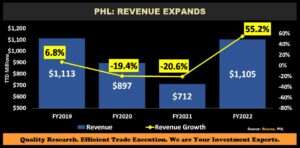
PHL’s total revenue advanced to $1.1B in FY2022 from $712M in FY2021, as a result of the improved economic activity for the period leading to the Group to progress towards pre-pandemic levels. Revenue growth expanded 55.2% relative, to a 20.6% decline in the prior period. Overall, the Group experienced segmental revenue growth with its Quick Service Restaurant and Casual Dining segments increasing 52.4% and 64.3% respectively, year-on-year.
The Group expects continued growth in its digital, delivery and drive-thru channels and is focused on building a robust platform to drive growth via its sales channels, signaling potential for further revenue improvement.
In 2023 thus far, PHL opened two new Starbucks locations in Brentwood and Aranguez, with a third location in O’Meara expected to be opened in Trinidad. The Group is also expected to open its first Starbucks restaurant in Guyana during Q1 2023. Guyana is positioned to maintain a positive economic standing, as the International Monetary Fund (IMF) expects GDP growth of 25.2% in 2023.
Margins Recover
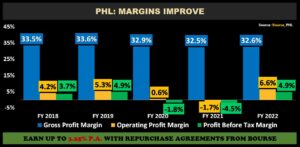
PHL’s Gross Profit Margin rose marginally from 32.5% in FY2021 to 32.6% in FY2022, despite food cost inflation due to inflationary pressures. Operating Profit Margin moved from -1.7% to 6.6 % in FY2022, supported by improving economic activity and the absence of enforced restaurant closures. This would have filtered into its Profit Before Tax (PBT) margin, showing recovery from -4.5% to 4.9%.
The Bourse View
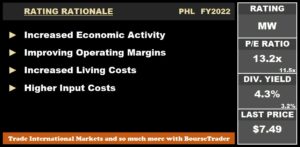
PHL trades at a current market price of $7.49 and trades at a P/E ratio of 13.2 times, above the trading sector average. The company announced a final dividend of $0.20 to be paid on May 15th 2023 to shareholders of record on April 13th, 2023. The stock offers investors a trailing dividend yield of 4.3%, above the sector average of 3.2%. While inflationary pressures could affect margins from both sales and input cost perspectives, PHL appears to be navigating the current environment relatively well. The Group noted that higher input and operating costs may continue to persist for some time, as management works to minimize its impact on the business and its customers. On the basis of improved profitability and relatively attractive dividend yields but tempered by inflationary pressures, Bourse maintains a MARKETWEIGHT rating on PHL.
The West Indian Tobacco Company Limited (WCO)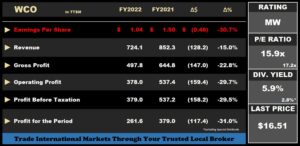
The West Indian Tobacco Company Limited (WCO) reported Earnings Per Share of $1.04 for the financial year ended December 31st 2022 (FY2022), a 30.7% decline from $1.50 reported in the prior comparable period. Revenue fell 15.0% Year on Year (YoY) from $852.3M to $724.1M, followed by a 9.1% increase in Cost of Sales. Consequently, Gross profit fell to $497.8M, 22.8% lower compared to $644.8M reported in FY2021. Distribution expense and other operating expense expanded by 47.5% and 37.1% respectively. Administrative expenses marginally declined 1.5% to bring Total Expenses to $119.8M, up 11.5% YoY. Operating Profit contracted 29.7%, from $537.4M in FY2021 to $378.0M in FY2022. WCO reported a Net Finance Income of $1.3M, relative to $0.1M in FY2021. Profit Before Tax fell 29.5% to $379.0M from $537.2M in FY2021. Overall, Profit After Taxation (PAT) declined 31.0% to close at $261.6M in FY2022 from a prior $379.0M.
Revenue Headwinds Persist
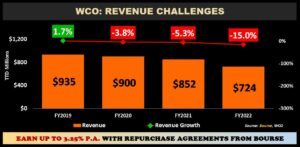
WCO’s revenue challenges continue to persist, with three consecutive years of negative revenue growth. Total Revenue contracted from $852M to $724M in FY2022, as consumer purchasing patterns changed characterized by the increased presence of lower cost substitutes and illicit products. The Group has taken steps to expand its product offerings by widening consumer options and building its Lucky Strike brand.
Domestic revenue (81.5% of Total Revenue) fell 21.1% to $590.3M from a previous $748.5M, while revenue from CARICOM and Non-CARICOM market advanced 28.9% to $133.8M (FY2021: $103.8M).
Margins Lower
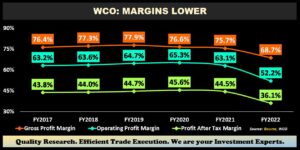
Traditionally one of the more stable operating margin companies, WCO’s Gross Profit Margin declined from 75.7% in FY2021 to 68.7% in the current period following a 9.1% increase in cost of sales likely owing to a fall in sales volume and increased costs of direct materials. Operating Margin deteriorated from 63.1% in FY2021 to 52.2% in FY2022, likely attributable to higher brand support expenditures as seen in the reported increases of distribution and other operating expenses. Consequently, Profit After Tax Margin fell to 36.1% in FY2022 relative to a prior 44.5%.
Dividends Lower
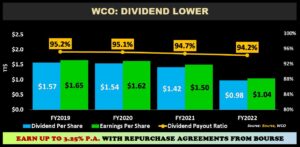
With the decline in earnings to $1.04 in the current period, WCO’s total dividend per share was cut to $0.98, 31.0% lower for FY2022 relative to $1.42 dividend per share in the prior period (FY2021). The company currently offers the third highest trailing 12-month dividend yield (5.9%) on the Trinidad and Tobago Stock Exchange with a pay-out ratio of 94.2%.
The Bourse View
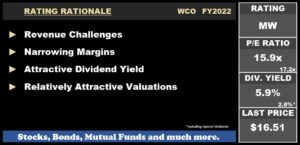
At a current price of $16.51, WCO trades at a P/E of 15.9 times, below the combined Manufacturing I&II sector average of 17.2 times. The company announced a proposed final dividend of $0.26 to be paid on May 25th 2023 to shareholders of record on May 8th 2023. The stock offers investors a trailing dividend yield of 5.9%, below the sector average of 7.2%. It should be noted that the sector average dividend yield excluding UCL’s special dividend would stand at 2.8%.
Continued inflationary pressures could affect demand for WCO, notwithstanding the generally ‘sticky’ nature of its product offerings. Demand challenges may be further compounded by the suspected presence of illicit substitute products. On the basis of relatively attractive valuations, but cognizant of lower dividends, narrower margins and revenue challenges, Bourse maintains a MARKETWEIGHT rating on WCO.
“This document has been prepared by Bourse Securities Limited, (“Bourse”), for information purposes only. The production of this publication is not to in any way establish an offer or solicit for the subscription, purchase or sale of any of the securities stated herein to US persons or to contradict any laws of jurisdictions which would interpret our research to be an offer. Any trade in securities recommended herein is done subject to the fact that Bourse, its subsidiaries and/or affiliates have or may have specific or potential conflicts of interest in respect of the security or the issuer of the security, including those arising from (i) trading or dealing in certain securities and acting as an investment advisor; (ii) holding of securities of the issuer as beneficial owner; (iii) having benefitted, benefitting or to benefit from compensation arrangements; (iv) acting as underwriter in any distribution of securities of the issuer in the three years immediately preceding this document; or (v) having direct or indirect financial or other interest in the security or the issuer of the security. Investors are advised accordingly. Neither Bourse nor any of its subsidiaries, affiliates directors, officers, employees, representatives or agents, accepts any liability whatsoever for any direct, indirect or consequential losses arising from the use of this document or its contents or reliance on the information contained herein. Bourse does not guarantee the accuracy or completeness of the information in this document, which may have been obtained from or is based upon trade and statistical services or other third party sources. The information in this document is not intended to predict actual results and no assurances are given with respect thereto.”

