NCBFG HY2023
- Earnings: EPS contracted 59.5% from TT$0.20 to TT$0.08
- Performance Drivers:
- Reduced Net Result from insurance activities
- Lower Net Operating Income
- Outlook:
- Economic normalization across operating jurisdictions
- Rating: Maintained at MARKETWEIGHT.
GHL Q12023
- Earnings: EPS declined 52.7% from $0.55 to $0.26
- Performance Drivers:
- Lower Net Insurance and Investment Result
- Higher Finance / Operating Expenses
- Increased Taxation
- Outlook:
- Economic Normalization
- Rating: Maintained at MARKETWEIGHT.
This week, we at Bourse review the performance of NCB Financial Group Limited (NCBFG) for the six months ended March 31st, 2023 (HY2023) and Guardian Holdings Limited (GHL) for the three months ended March 31st 2023 (Q12023). Both Groups grappled with reduced earnings and operating income, mainly impacted by events in the Life, Health and Pension segment. Can NCBFG and GHL recover, despite the still uncertain operating environment? We discuss below.
NCB Financial Group Limited (NCBFG)

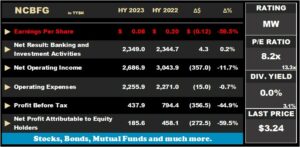
NCB Financial Group Limited (NCBFG) reported an Earnings Per Share (EPS) of TT$0.08 for the six months ended 31st March 2023 (HY2023), slipping 59.5% from TT$0.20 in the prior comparable period (HY2022).
Net Interest Income expanded 6.2% as the Group recorded growth in its interest earning portfolios. Net Result of Banking and Investment Activities grew marginally by 0.2%, improving from TT$2.34B in HY2022 to TT$2.35B in the present quarter. Net Revenues from Insurance Activities fell 51.7% from TT$699.1M in Q12022 to TT$337.9M in Q12023. Net Operating income dropped 11.7% to $2.7B. This performance was driven by events in the Life, Health and Pension (LHP) insurance segment, particularly, the effects of a one-off actuarial adjustment in the first three months of the financial year. Operating expenses fell 0.7% in HY2023 to TT$2.25B from $2.27B the previous year, as the group continues to implement its cost optimization measures. Overall, Operating Profit fell by 44.2% in Q12023 to TT$430.96M. In the period under review, the Share of Profit of Associates declined 67.9% to TT$6.89M. Profit Before Taxation decreased 44.9% to TT$437.9M from TT$794.4M in the prior comparable period (HY2022). In HY2023, taxation expenses increased to TT$159.6M, 29.4% higher than the TT$123.3M in HY2022. Net Profit Attributable to Shareholders fell 59.5%, from $458.1M in the previous quarter to $185.6M in HY2023.
Lower Operating Income

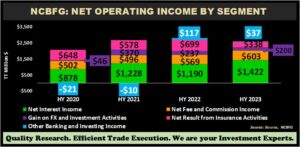
NCBFG reported an 11.7% decline to TT$2.7B in Net Operating Income for the Half-year ended March 31st 2023, predominantly impacted the one-off actuarial adjustment in Life, Health Insurance and Pension Fund Management Segment.
Net Interest Income, the largest component of Net Operating Income (56.2%), expanded 6.2% as the Group recorded growth in its interest earning portfolios. NCBFG’s reported a 6.0% increase in Net Fee and Commission Income (22.4% of Net operating Income), resulting from growth in loans and investments portfolios and increased transaction volumes. Net Revenues from Insurance Activities (12.6% of Net Operating Income) contracted 51.7% from TT$15.9M in HY2022 to TT$7.7M in HY 2023. The segment recorded a decline in premium income and higher insurance costs and commission and selling expenses. Gains on Foreign Currency and Investment Activities decreased 15.8% due to lower gains from the sale of debt securities stemming from higher interest rates. Other Banking and Investing Income declined 68.6% to TT$36.8M contributing 1.4% of Net Operating Income.
Operating Profit by Activity

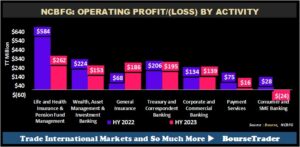
Operating Profit decreased 44.2% year over year to TT$430.96M from TT$772.9M in HY2022. Life and Health Insurance & Pension Fund Management (44.2% of Operating Profit) saw a decrease from TT$583.7M to TT$262.3M, representing an 55.1% fall. Treasury and Correspondent Banking (15.6% of Operating Profit) fell 5.2% year over year. Corporate and Commercial Banking (10.2% of Operating Profit) increased 3.5%. Asset Management and Investment Banking (17.0% of Operating Profit) fell 31.8% to TT$152.7M as a result of higher interest rates and Payment Services (accounting for 5.7% of operating profit) dropped 78.6% to TT$16.1M. General Insurance increased 174.0% from TT$67.9M to TT$186.1M. Consumer and SME Banking Wealth experienced the largest loss of TT$51.6M due to higher credit impairment provisions.

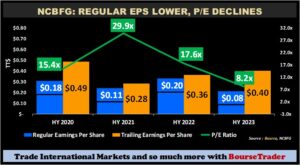
NCBFG posted an EPS of TT$0.08 in HY2023, down from TT$0.20 in the prior comparable period. trailing 12-month earnings per share increased from TT$0.36 in HY2022 to TT$0.40 in HY2023. As a result of this and 28.9% fall in share price year-to-date, the Group’s Price-to-Earnings (P/E) multiple has adjusted from 17.6 times in HY2022 to a lower multiple of 8.2 times in HY2023. Historically, NCBFG would have traded at a ‘pre-COVID’ earnings multiple of around 16.0 times (during 2017-2019).
The Bourse View

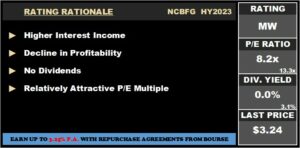
NCBFG is currently priced at $3.24 and trades at a modest price to earnings ratio of 8.2 times, relative to the Banking Sector average of 13.3 times. The stock offers investors a trailing dividend yield of 0.0%, materially below the sector average of 3.1%, as the financial group has not issued a dividend payment since May 2021. The one-off actuarial adjustment has affected the largest segment of operating profit thus leading to reduced revenues in the Life, Health, and Pensions segment. Despite weaker performance from its Insurance Activities, the Group’s Banking and Investment Activities remained relatively resilient. From a relative value basis, NCBFG appears attractive when comparing its price-to-book (P/B) ratio to industry peers (NCBFG: 1.1 times, industry average: 1.8 times). On the basis of relatively attractive P/E and P/B multiples but tempered by a continued absence of dividends and volatile profitability, Bourse maintains a MARKETWEIGHT rating on NCBFG.
Guardian Holdings Limited (GHL)

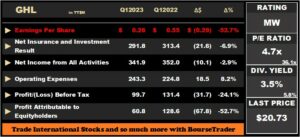
Guardian Holdings Limited (GHL) reported Earnings per Share of $0.26 for its first quarter ended March 31st 2023, down 52.7% from $0.55 in the prior comparable period. It should be noted that GHL’s implementation of the new International Financial Reporting Standard (IFRS) 17 would have significantly adjusted the presentation of its financial performance.
Insurance Service Result expanded 30.1% from $147.8M in the prior period to $192.3M in Q12023. Net Income from Investing Activities also increased 30.8% to $299.6M, mainly due to lower fair value losses and increased investment returns from financial assets in current year. This was offset by higher Net insurance finance expenses by $136.7M from $63.4M in Q12022, primarily arising from the LHP segment. Consequently, Net Insurance and Investment Result amounted to $291.8M relative to $313.4M in Q12022, 6.9% lower. Fee and commission income from brokerage activities advanced by $11.5M or 29.9% year-on-year, supported by increased brokerage activities in the Dutch Caribbean. Net Income from all activities fell 2.9% to $341.9M in the period under review. Other operating expenses rose 15.0% YoY as a result of sales-related expenses, growth strategies across the Group’s business segments, and continued costs associated with the new IFRS 17 implementation. Operating Profit contracted 22.5% from $127.2M to $98.6M in Q12023. Share of after-tax profits of associated companies declined to $1.0M. Profit Before Taxation amounted to $99.7M, relative to $127.2M in the prior period. Taxation grew from $2.3M to $37.7M in Q12023. Profit for the Period stood at $62.0M, dropping 52.0% from the equivalent prior period (IFRS 17) comparative of $129.1M. Overall, Profit Attributable to Equity Holders of the Company recorded a decline of $67.8M to $60.8M, (52.7% lower) compared to the profit of $128.6M in the same period last year.
LHP Segment Down
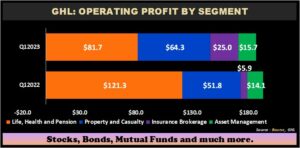
Operating Profit for the period came in at $98.6M during the three -month period, contracting 22.5% from the prior comparable period. Life, Health and Pension (LHP) (82.8% of operating profit) declined 32.6% year on year from $121.3M to $81.7M, primarily driven by higher finance expenses from long-term insurance contracts and taxation. Segmental finance expenses were negatively impacted by the IFRS 17 driven changes in the financial assumptions on the carrying amounts of insurance contracts and their associated financial assets.
The Property and Casualty Segment (65.2% of Operating Profit) advanced 24.2% to $64.3M in Q12023, positively impacted due to slightly higher insurance revenues and lower insurance service expenses. Insurance Brokerage saw the largest gain, expanding to $25.0M, due to increased fee and commission income from brokerage activities. Asset Management rose 11.3% from $14.1M in Q12022 to $33.7M in Q12023.
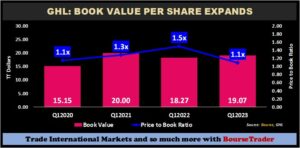
From a value perspective, GHL’s book value per share advanced from $18.27 in Q12022 to $19.07 in the most recent period. The concurrent decline in GHL’s price has led to its price to book ratio decreasing from 1.5 times in Q12022 to 1.1 times, suggesting that investors are currently paying less on a per-share basis to own net assets of the company.
The Bourse View
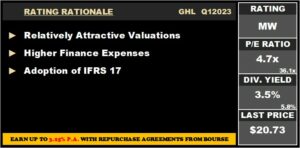
GHL is currently priced at $20.73 and trades at a price to earnings ratio of 4.7 times, significantly below the Non-Banking Financial Sector average of 36.1 times. The stock currently offers investors a trailing dividend yield of 3.5% relative to a sector average of 5.8%. The Group made the decision to not declare an interim dividend payment in its latest earnings release, which may be a yellow flag for income-oriented investors.
On the basis of relatively attractive valuations but tempered by lower earnings as well as the impact of major accounting changes to financial presentation and by extension investor sentiment, Bourse maintains a MARKETWEIGHT rating on GHL.
“This document has been prepared by Bourse Securities Limited, (“Bourse”), for information purposes only. The production of this publication is not to in any way establish an offer or solicit for the subscription, purchase or sale of any of the securities stated herein to US persons or to contradict any laws of jurisdictions which would interpret our research to be an offer. Any trade in securities recommended herein is done subject to the fact that Bourse, its subsidiaries and/or affiliates have or may have specific or potential conflicts of interest in respect of the security or the issuer of the security, including those arising from (i) trading or dealing in certain securities and acting as an investment advisor; (ii) holding of securities of the issuer as beneficial owner; (iii) having benefitted, benefitting or to benefit from compensation arrangements; (iv) acting as underwriter in any distribution of securities of the issuer in the three years immediately preceding this document; or (v) having direct or indirect financial or other interest in the security or the issuer of the security. Investors are advised accordingly. Neither Bourse nor any of its subsidiaries, affiliates directors, officers, employees, representatives or agents, accepts any liability whatsoever for any direct, indirect or consequential losses arising from the use of this document or its contents or reliance on the information contained herein. Bourse does not guarantee the accuracy or completeness of the information in this document, which may have been obtained from or is based upon trade and statistical services or other third party sources. The information in this document is not intended to predict actual results and no assurances are given with respect thereto.”

