
HIGHLIGHTS
NCBFG Q12025
- Earnings: EPS advance 109.6% from TT$0.023 to TT$0.048
- Performance Drivers:
- Increased Insurance service result
- Higher Net Operating Income
- Outlook:
- Increase Economic Activity
- Rating: Assigned to MARKETWEIGHT
JMMBGL 9M2025
- Earnings: EPS fell 90.2% from TT$0.367 to TT$0.036
- Performance Drivers:
- Increased Net Interest Income
- Lower Operating Revenue
- Modest Dividend Yield
- Associate P/L Volatility
- Outlook:
- Cost Management Initiatives
- Rating: Assigned to MARKETWEIGHT
This week, we at Bourse review the performance of Banking sector member NCB Financial Group Limited (NCBFG) and JMMB Group Limited (JMMBGL), a member of the Non-Banking Sector for their respective reporting periods, three months (Q12025) and nine months (9M2025) ended December 31st, 2024. NCBFG’s results benefitted from increased revenues from its insurance division, while JMMBGL’s performance was impacted by lower Share of Profit from Associate. How might these Jamaican-born Groups fare in the upcoming months ahead? We discuss below.
NCB Financial Group Limited (NCBFG)
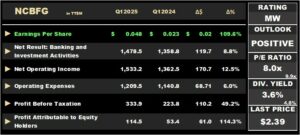
NCB Financial Group Limited (NCBFG) reported an Earnings Per Share (EPS) of TT$0.048 for the first fiscal quarter ended December 31, 2024 (Q12025), 109.6% higher than the TT$0.023 reported in Q12024.
Net Interest Income grew 11.6% YoY to TT$872.2M from a prior TT$781.9M, supported by improved performance from their interest-earning asset portfolio. Net Revenues from Banking and Investment Activities advanced 8.8%, from a prior TT$1.36B to TT$1.48B. Insurance service result increased from TT$270.4M in Q12024 to TT$327.6M in the current period (+21.2%), owing to lower service expenses resulting from a reduction in gross claims from the property and casualty business. Overall, Net Operating Income improved by 12.5%, to TT$1.53B from a previous TT$1.36B. Operating Expenses grew 6.0% year on year, resulting in an expansion in Operating Profit by 46.0% to TT$323.7M. Share of Profit of Associates climbed significantly by 408.7%, from TT$2.0M to TT$10.2M in Q12025. Profit Before Tax stood at TT$333.9M, 49.2% higher than $223.8M compared to the prior period. Despite an increase of 13% in Taxation expense, the effective tax rate fell from 42% to 32% year on year,resulting in an increase of 73.3% in Net Profit to TT$224.5M for Q12025. Overall, Net Profit Attributable to Shareholders rose to TT$114.5M from TT$53.4M, an improvement of 114.3% year on year.
Operating Profit by Activity
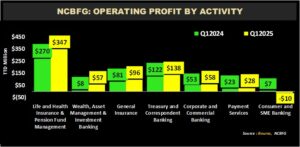
NCBFG’s Total Operating Profit by Segment remained relatively flat YoY. With the exception of Consumer and SME Banking, all segments produced positive results. Life and Health Insurance & Pension Fund Management advanced 28.3% from TT$270.5M to TT$347.0M in Q12025. Treasury and Correspondent Banking expanded 13.0% from TT$121.7M to TT$137.5M. Payment Services, increased by double-digit growth of 21.8%, from TT$22.8M to TT$27.8M. Wealth, Asset Management, and Investment Banking grew significantly by 575.0%, from TT$8.4M to TT$56.5M. Conversely, the Consumer and SME Banking segment experienced a loss of TT$10M relative to an operating profit of TT$7M in Q12024.
More Attractive Value?
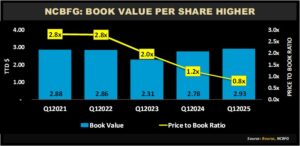
NCBFG’s book value per share has progressively increased, ranging from $2.31 in Q12023 to TT$2.93 in Q12025, with an average book value per share of TT$2.72 over the past five reporting quarters. The Group’s Price-to-Book ratio stood at 0.8 times in Q12025, compared to 1.2 times in the prior period. This also compares favourably to the sector average of 1.3 times, making NCBFG the most attractively valued Banking stock on a P/B basis.
The Bourse View
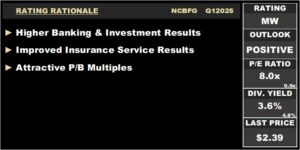
NCBFG is currently priced at $2.39 at a trailing P/E ratio of 8.0 times, below the Banking Sector average of 9.9 times. The stock offers investors a trailing dividend yield of 3.6%, below the sector average of 4.8%.
NCBFG’s focus on cost optimisation initiatives appears to be yielding improved results which, together with more consistent dividend payments, should be received favourably by investors. On the basis of improving results, relatively attractive valuations and the resumption of dividend payments, Bourse assigns a MARKETWEIGHT rating on NCBFG.
JMMB Group Limited (JMMBGL)
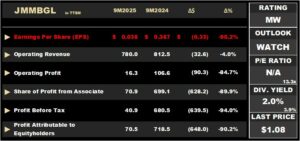
JMMB Group Limited (JMMBGL) reported an Earnings Per Share (EPS) of TT$0.036 for its nine months ended December 31st, 2024 (9M2025), down 90.2% compared to TT$0.367 in the prior comparable period.
Net Interest Income advanced 5.7% to TT$349.4M in 9M2025 from a prior TT$330.5M. Fee and Commission Income fell marginally by 0.2% to TT$167.1M. Gains on Securities Trading dropped 28.4% from TT$215.2M to TT$154.1M in 9M2025. Subsequently, Operating Revenue net of interest expense fell 4.0% year-on-year (YOY) from TT$812.5M in 9M2024 to TT$780.0M in 9M2025. Operating Expenses rose 7.8% to TT$763.7M. Operating Profit declined by TT$87.8M (84.3%) to TT$16.3M in 9M2025. The Group generated a gain on sale of capital assets of TT$56.8M in the period under review. Other income declined 30.1% to TT$1.4M and Impairment loss on financial assets fell 31.3% to TT$47.7M in 9M2025. Share of Profit of Associate amounted to TT$70.9M in 9M2025 relative to TT$699.1M in the prior year period, down 89.9% YoY, leading to a Profit Before Tax of TT$40.9M (9M2024: TT$680.5M). Overall, Profit Attributable to Equity Holders stood at TT$70.5M, decreasing 90.2% from TT$718.5M reported in 9M2024.
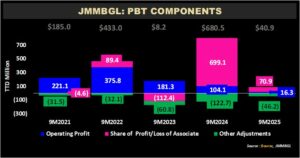
JMMBGL’s Profit before Tax (PBT) dipped to TT$40.9M in 9M2025 from TT$680.5M in 9M2024. Likewise, an Operating Profit of TT$16.3M was recorded for 9M2025, down from TT$104.1M. JMMBGL’s Share of Profit of Associate amounted to TT$70.9M, falling 89.9% YoY from TT$699.1M. According to the Group, JMMB’s 24.56% shareholding in Sagicor Financial Company Limited (SFC) contributed TT$75.7M to the Group’s share of profit for the nine-month period under review.
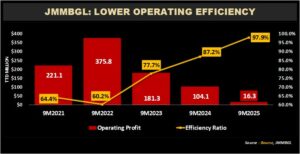
JMMBGL’s efficiency ratio deteriorated from 87.2% in 9M2024 to 97.9% in 9M2025, reflecting reduced operational efficiency as shown by the drop in Operating Profits to TT$16.3M. This suggests that a larger portion of the company’s income, after accounting for interest expenses, is being consumed by operating costs – a lower ratio typically indicates better cost management. Operating expenses rose from TT$708.5M to TT$763.7M, reflecting inflationary pressures among other factors. The Group’s ability to effectively prioritize investments for scaling and improving efficiency will be key to enhancing long-term shareholder value.
The Bourse View
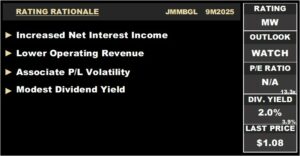
JMMBGL currently trades at a market price of $1.08 and offers investors a trailing dividend yield of 2.0%, below the Non-Banking Finance sector average of 3.9%.
The Group’s core financial performance remains influenced by a myriad of dynamic economic conditions, including elevated interest rates, inflationary pressures, and reduced trading activity in regional markets. On the basis of subdued operating results and share of profit of profit from associate, Bourse assigns a MARKETWEIGHT rating on JMMBGL.
“This document has been prepared by Bourse Securities Limited, (“Bourse”), for information purposes only. The production of this publication is not to in any way establish an offer or solicit for the subscription, purchase, or sale of any of the securities stated herein to US persons or to contradict any laws of jurisdictions which would interpret our research to be an offer. Any trade in securities recommended herein is done subject to the fact that Bourse, its subsidiaries and/or affiliates have or may have specific or potential conflicts of interest in respect of the security or the issuer of the security, including those arising from (i) trading or dealing in certain securities and acting as an investment advisor; (ii) holding of securities of the issuer as beneficial owner; (iii) having benefitted, benefitting or to benefit from compensation arrangements; (iv) acting as underwriter in any distribution of securities of the issuer in the three years immediately preceding this document; or (v) having direct or indirect financial or other interest in the security or the issuer of the security. Investors are advised accordingly. Neither Bourse nor any of its subsidiaries, affiliates directors, officers, employees, representatives, or agents, accepts any liability whatsoever for any direct, indirect or consequential losses arising from the use of this document or its contents or reliance on the information contained herein. Bourse does not guarantee the accuracy or completeness of the information in this document, which may have been obtained from or is based upon trade and statistical services or other third-party sources. The information in this document is not intended to predict actual results and no assurances are given with respect thereto.”