
FCGFH Q12023
- Earnings: Earnings Per Share increased 9.7% from $0.72 to $0.79
- Performance Drivers:
- Higher Operating Profit
- Credit Impairment Gains
- Outlook:
- Normalization of economic activity
- Rating: Assigned as MARKETWEIGHT
Local Market Performance (Jan 31st, 2023)
- TTCI ↓7%
- ALL T&T ↓ 3%
- CLX ↑6%
This week, we at Bourse review the performance of local Banking Sector giant First Citizens Group Financial Holdings Limited (FCGFH) for the three months ended 31st December, 2022 (Q12023), with the Group generating higher operating profits. We also provide a brief update on TTSE’s trading activity as at January 31st, 2023.
First Citizens Group Financial Holdings Limited (FCGFH)
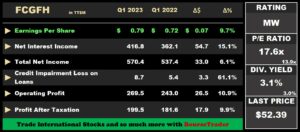
First Citizens Group Financial Holdings Limited (FCGFH) reported an Earnings Per Share (EPS) of $0.79 for the three months ended 31st December, 2022 (Q1 2023), up 9.7% relative to $0.72 reported in the prior comparable period (Q1 2022).
Net Interest Income expanded 15.1% from $362.1M in Q1 2022 to $416.8 M in Q1 2023. Other Income contracted 12.4%% from $175.3M to $153.6M. Resultantly, Total Net Income increased 6.1% to stand at $570.4M. Credit Impairment Losses Net Recoveries continued to reverse, increasing 61.6% from a reversal of $5.4M in Q1 2022 to $8.7M in Q1 2023. Non-Interest Expenses increased 3.2%, from $299.8M in Q1 2022 to $309.6M in Q1 2023. Ultimately, Operating Profit increased 10.9% to $269.5M.
FCGFH reported a total Share of Profit in Associates and Joint Ventures of $5.8M, up 16.3% from a prior $5.4M. Profit Before Taxation expanded to $275.3M. Taxation Expense increased 13.4% to $75.8M, with the Group’s effective tax rate increasing marginally from 26.9% in Q1 2022 to 27.5% in Q1 2023. Overall, Profit After Taxation increased 9.9% to $199.5M, relative to $181.6M in Q1 2022.
Segment Performance Higher
-
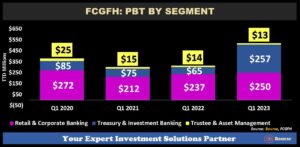
FCGFH grew its Profit Before Tax (PBT) by 10.8% YoY. Underpinning this performance was a substantial increase of 295.9% in its Treasury & Investment Banking segment, which was the largest contributor to PBT, accounting for 49.5% of PBT before eliminations. Retail & Corporate Banking, the second largest contributor to PBT (48% before eliminations) advanced 5.5% YoY. Trustee & Asset Management (2.5% of PBT before eliminations) fell 8.6%, likely owing to reduced business activity.
-
-
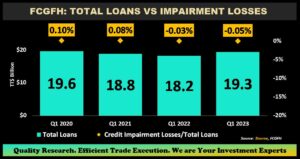
FCGFH Loans to Customers increased 6.2% over the period from $18.2B to $19.3B in Q12023, depicting an increase in demand for loans. The Group recorded a reversal in its Credit Impairment Losses in the amount of $8.7M, signalling an improvement of their loan portfolio’s estimated credit quality.
Future performance will be dependent on the Bank’s ability to expand its loan portfolio as well as its investment portfolio, while employing strategies to keep expenses in check. Improving economic activity could also improve general credit conditions, which may be partially offset by the current inflationary pressures.
-
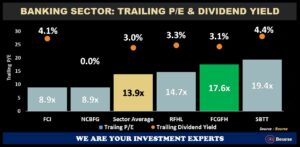
Price-to-Earnings multiples across the banking sector currently range from 8.9 times to 19.4 times. FCGFH currently trades at the more expensive end of the relative value spectrum, with a trailing P/E multiple of 17.6 times, above the sector average of 13.9 times. FCGFH offers investors a trailing dividend yield of 3.1% (pay-out ratio: 54.7%) relatively in-line with the Banking Sector Average of 3.0%.
-
The Bourse View
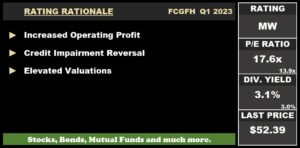
FCGFH is currently priced at $52.39 and trades at a P/E ratio of 17.6 times, above the Banking Sector average of 13.9 times. Historically, FCGFH would have traded at a ‘pre-COVID’ earnings multiple of around 13.0 times (during 2017-2019). The Group declared an interim dividend of $0.43 per share to be paid on March 3rd, 2023 to shareholders on record by February 15th, 2023. The stock offers investors a dividend yield of 3.1%, in line with the sector average of 3.0%. The Group has stated its intention to focus on its core range of services, by continuing to strengthen its brand and enhancing customer experience with its digital transformation initiatives. On the basis of improving performance, elevated valuations and lingering financial market uncertainty, Bourse assigns a MARKETWEIGHT rating on FCGFH.
Local Markets Performance
As at January 31st, 2023 – The Trinidad and Tobago Composite Index (TTCI) and the All Trinidad and Tobago Index (All T&T) fell 0.7% and 1.3% respectively, while the Cross Listed Index (CLX) increased 1.6%.
Major Movers on the TTCI
-
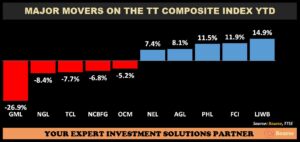
L.J. Williams Limited, “B” (LJWB) was the best performing stock year-to-date, encompassing the period from December 30th, 2022 to January 31st, 2023. LJWB advanced 14.9% supported by improvements in their Food Division and Shipping Division. First Caribbean International Bank Limited (FCI) appreciated 11.9%, driven by improved revenues, increased activity-based operating income and lower provisions for credit losses. Prestige Holdings Limited (PHL) climbed 11.5%, buoyed by improving operating margins and recovering revenues. Agostini’s Limited (AGL) was positively impacted by margin growth and acquisition activity. National Enterprises Limited (NEL) was up 7.4%, propelled by gains observed in the investee companies’ valuation from the energy segment of NEL’s portfolio.
Major decliners for YTD (December 30th 2022 to January 31st 2023) included, Guardian Media Limited (GML â 26.9%), Trinidad and Tobago NGL Limited (NGL â 8.4%), Trinidad Cement Limited (TCLâ7.7), NCB Financial Group Limited (NCBFG â 6.8) and One Caribbean Media Limited (OCM â 5.2%).
-
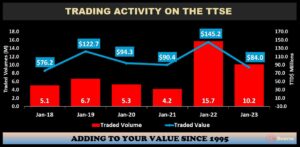
Trading activity on the Trinidad and Tobago Stock Exchange (TTSE) for the month of January 2023 registered a volume of 10.2M shares, with a traded value of $84.0M. Massy Holdings Limited (MASSY) dominated trading by volume, accounting for 38.1% of total traded volume, followed by JMMB Group Limited (JMMBGL). January 2023’s activity represents a decline in both traded volumes and traded values over the prior comparable period, falling 35.3% and 42.1% respectively from 15.7M shares and $145.2M in value in the prior year.
Caribbean Exchange Index (CXNI) Data now Available
Investors can now access the Caribbean Exchange Index (CXNI) on the Trinidad & Tobago Stock Exchange (TTSE) website. The CXNI was launched as a Regional Index gauge in October 2022 during the TTSE’s 40th Anniversary Conference.
The CXNI is a collective effort coordinated by the 5 regional stock exchanges: Jamaica, Barbados, The Eastern Caribbean, Guyana and Trinidad and Tobago. This was consolidated to provide investors both regionally and internationally, a gauge of the Caribbean regions’ overall market performance. It collates the activity recorded of the main market stocks for each country’s exchanges into a singular comprehensive unit of measurement which can be noted when making investment decisions.
“This document has been prepared by Bourse Securities Limited, (“Bourse”), for information purposes only. The production of this publication is not to in any way establish an offer or solicit for the subscription, purchase or sale of any of the securities stated herein to US persons or to contradict any laws of jurisdictions which would interpret our research to be an offer. Any trade in securities recommended herein is done subject to the fact that Bourse, its subsidiaries and/or affiliates have or may have specific or potential conflicts of interest in respect of the security or the issuer of the security, including those arising from (i) trading or dealing in certain securities and acting as an investment advisor; (ii) holding of securities of the issuer as beneficial owner; (iii) having benefitted, benefitting or to benefit from compensation arrangements; (iv) acting as underwriter in any distribution of securities of the issuer in the three years immediately preceding this document; or (v) having direct or indirect financial or other interest in the security or the issuer of the security. Investors are advised accordingly. Neither Bourse nor any of its subsidiaries, affiliates directors, officers, employees, representatives or agents, accepts any liability whatsoever for any direct, indirect or consequential losses arising from the use of this document or its contents or reliance on the information contained herein. Bourse does not guarantee the accuracy or completeness of the information in this document, which may have been obtained from or is based upon trade and statistical services or other third party sources. The information in this document is not intended to predict actual results and no assurances are given with respect thereto.”