HIGHLIGHTS
FCI 9M2024
- Earnings: Earnings Per Share of TT$0.90 to TT$0.90
- Performance Drivers:
- Revenue Growth
- Higher Interest income
- Higher Operating Expenses
- Outlook:
- Increased Economic Activity
- Lower US benchmark interest rates
- Rating: Maintained at OVERWEIGHT
SBTT 9M2024
- Earnings: Earnings Per Share 3.9% higher, from $2.66 to $2.77
- Performance Drivers:
- Higher Revenues
- Outlook:
- Increased Economic Activity
- Rating: Maintained at MARKETWEIGHT
This week, we at Bourse review the performance of two key players of the Banking Sector, CIBC Caribbean Bank Limited (Formerly First Caribbean International Bank Limited) and Scotiabank Trinidad & Tobago (SBTT) during their respective nine-month period (9M2024) ending July 31, 2024. Both FCI and SBTT reported revenue growth, sustained by moderating levels of economic activity within their operating jurisdictions. Could FCI and SBTT continue their positive momentum in the upcoming months? We will discuss below.
FirstCaribbean International Bank Limited (FCI)

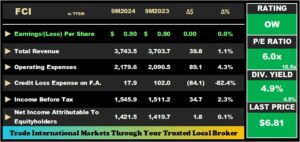
FirstCaribbean International Bank Limited (FCI), now rebranded “CIBC Caribbean’, reported Earnings per Share (EPS) of TT$0.90 for the nine months ended July 31st, 2024 (9M2024), which remained unchanged relative to the prior reporting period (9M2023).
Total Revenue expanded by 1.1% year on year, from TT$3.70B in 9M2023 to TT$3.74B in 9M2024. Operating Expenses grew to TT$2.18B from a prior TT$2.09B, resulting in an increase of 4.3%, owing to higher strategic investments and activity-based costs initiatives. Notably, FCI’s Credit Loss Expense on Financial Assets fell significantly by 82.4%, which amounted to TT$17.9M in 9M2024 versus TT$102.0M in the prior period, resulting from a prior non-recurring account recovery in the Bahamas. Income Before Tax (PBT) stood at TT$1.55B, 2.3% higher than TT$1.51B in 9M2023, with an effective tax rate of 17% maintained year on year. Hence, the Group’s reported Income Tax Expense of TT$111.6M (+11.0%), leading to an overall increase in Net Income Attributable to Equity Holders by a marginal 0.1% to TT$1.42B, from a prior TT$1.42B.
Revenue Higher

For the first nine months of fiscal year 2024, FCI’s Total Revenue continued to trend upwards relative to prior reporting periods. Total Revenue grew marginally by 1.1% year on year to $3.74B from a prior TT$3.70B in 9M2023. Net Interest Income, the Group’s principal source of revenue (72%), improved by 1.1% to TT$2.68B compared to TT$2.65B, owing to higher net interest margin in FCI’s US Dollar loan portfolio and volume growth, according to the Group. Similarly, Operating Income (28% of Revenue), rose by 1.1% to TT$1.06B. The Group’s loan portfolio performed relatively higher in the current period by 1.7% YoY to TT$6.79B, following increased economic activity and general improvement in the Group’s loan credit quality across the region. Investors would note that the bank’s higher revenues, heavily influenced by higher USD, benchmark rates, may begin to moderate as the US Federal Reserve begins its rate-cutting cycle.
Operating Income by Activity

FCI’s Profit Before Tax (PBT) improved roughly by 2.3% Year over Year (YoY) to TT$1.55B in 9M2024 versus TT$1.51B in 9M2024. The Bank’s largest contributor to PBT growth, Corporate and Investment Banking (CIB) accounted for 80.8% of PBT, reported a Profit Before Tax of TT$1.25B, a decline of 0.9% from a prior TT$1.26B. Retail, Business and International Banking (RBB) contributed 9.8% to PBT, resulted in 66.1% improvement year on year from TT$91M in 9M2023 versus TT$151M in the current review period. The Group’s Wealth Management segment (3.4% of PBT) contracted by 22%, from TT$67M in 9M2023 versus TT$52M in 9M2024.
The Bourse View

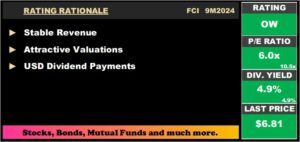
FCI currently trades at a price of $6.81 at a trailing PE ratio of 6.0 times, below the Banking Sector average of 10.5 times. The stock offers investors a trailing dividend yield of 4.9%, in-line with sector average of 4.9%. The Group announced an interim dividend of US$0.0125 (TT$0.08) per share payable to shareholders on October 18, 2024.
FCI continued its robust performance for the current review period, surpassing historical revenue levels, supported by moderating levels of economic activity across the region. However, further expected reductions in US benchmark interest rates will likely weigh on the Bank’s topline performance with a likely gradual reversion of P/E ratio to the sector average. On the basis of revenue growth, attractive P/E multiples and USD dividends, Bourse maintains an OVERWEIGHT rating on FCI.
Scotiabank Trinidad and Tobago Limited (SBTT)

Scotiabank Trinidad and Tobago Limited (SBTT) reported Earnings per Share (EPS) of $2.77 for the nine-month period ending July 2024, reflecting a decrease of 3.9% compared to $2.66 in the prior year.
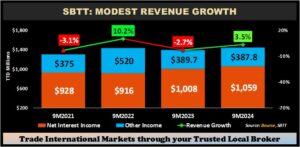
SBTT’s Net Interest Income grew by 5.1% to $1.1B, while Other Income slightly decreased by 0.5% from $389.7M to $387.8M in 9M2024. Total Revenue for the period reached $1.4B, marking a 3.5% year-on-year increase, driven largely by net interest income. Non-Interest Expenses increased by 8.4%, rising from $577.6M in 9M2023 to $625.9M in 9M2024. SBTT reported a significant reduction of 19.4% in Net Impairment Loss on Financial Assets, totaling $68.0M compared to $84.4M in 9M2023. Profit before Taxation rose by 2.4% to $752.7M, up from $735.3M in the last reporting period, while Income Tax Expense decreased to $264.3M. Overall, the Group reported a Profit for the Period of $488.4M, a 4.0% increase from $469.7M in 9M2023.
Modest Revenue Growth

Total Revenue for SBTT increased by $49.2M, or 3.5%, reaching $1.45B compared to $1.40B in the last reporting period. Net Interest Income (73.2% of the Group’s Total Revenue) advanced 5.1% from $1.01B in 9M2023 to $1.06B in 9M2024. This growth was fueled by loan portfolio expansion in both retail and commercial segments. Conversely, Other Income (26.8% of Total Revenue) decreased by 0.5% to $387.8M, reportedly owing mostly to reduced trading revenues amid unfavorable market sentiment, which was offset by revenue growth in the insurance segment.
The Retail Corporate & Commercial Banking segment, which is SBTT’s largest operational segment by revenue, displayed marginal growth of 0.9%, while the Asset Management and Insurance Services segments saw notable increases of 50.1% and 45.4%, respectively.
Loans Increase, Impairment Expenses Fall

SBTT’s Total Loan Portfolio increased by 6.6%, growing from $19.3B in 9M2023 to $20.6B in 9M2024, reflecting customer confidence and competitive offerings.
Loans to Customers (96.5% of Total Loans) rose by 7.7% to $19.8B. This growth was partially offset by a 15.8% decline in Loans and Advances to Banks and Related Companies, which decreased to $720M. Net Impairment Losses on financial assets were recorded at $68.0M for the current period, down 19.4%, resulting in an drop in the ratio of Net Impairment Losses of Total Loans, which fell to 0.33% in 9M2024 from 0.44% in 9M2023, signaling improved delinquency rates within the loan portfolio.
The Bourse View

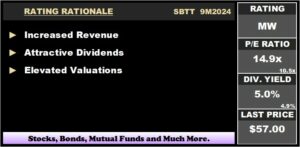
SBTT’s stock is priced at $57.00, trading at a Trailing Price to Earnings ratio of 14.9 times, which is above the banking sector average of 10.5 times. The stock provides investors with a trailing dividend yield of 5.0%, in line with the sector average of 4.9%. The Group has declared an interim dividend payment of $0.70 per share, scheduled for payment on October 11, 2024.
The Group’s strong commitment to dividend payments is evident in its dividend payout ratio of 75% for 9M2024, reinforcing its attractiveness for income-oriented investors. On the basis of improved revenues, tempered by elevated valuations, Bourse maintains a MARKETWEIGHT rating on SBTT.
“This document has been prepared by Bourse Securities Limited, (“Bourse”), for information purposes only. The production of this publication is not to in any way establish an offer or solicit for the subscription, purchase or sale of any of the securities stated herein to US persons or to contradict any laws of jurisdictions which would interpret our research to be an offer. Any trade in securities recommended herein is done subject to the fact that Bourse, its subsidiaries and/or affiliates have or may have specific or potential conflicts of interest in respect of the security or the issuer of the security, including those arising from (i) trading or dealing in certain securities and acting as an investment advisor; (ii) holding of securities of the issuer as beneficial owner; (iii) having benefitted, benefitting or to benefit from compensation arrangements; (iv) acting as underwriter in any distribution of securities of the issuer in the three years immediately preceding this document; or (v) having direct or indirect financial or other interest in the security or the issuer of the security. Investors are advised accordingly. Neither Bourse nor any of its subsidiaries, affiliates directors, officers, employees, representatives or agents, accepts any liability whatsoever for any direct, indirect or consequential losses arising from the use of this document or its contents or reliance on the information contained herein. Bourse does not guarantee the accuracy or completeness of the information in this document, which may have been obtained from or is based upon trade and statistical services or other third-party sources. The information in this document is not intended to predict actual results and no assurances are given with respect thereto.”

