HIGHLIGHTS
CIBC FY2024
- Earnings: Earnings Per Share 3.0% higher, from $1.12 to $1.15
- Performance Drivers:
- Improved Revenues
- Higher Interest income
- Higher Operating Expenses
- Outlook:
- Increased Economic Activity
- Lower US benchmark interest rates
- Rating: Assigned to MARKETWEIGHT
SBTT FY2024
- Earnings: Earnings Per Share 0.5% higher, from $3.72 to $3.73
- Performance Drivers:
- Higher Revenues
- Outlook:
- Increased Economic Activity
- Rating: Maintained at MARKETWEIGHT
This week, we at Bourse review the performance of two locally listed, Canadian banking giants, CIBC Caribbean Limited (CIBC) and Scotiabank Trinidad and Tobago Limited (SBTT) for their respective full year financial results for the period ending October 31st, 2024. Both banks reported revenue growth, supported by moderating levels of economic activity across their operating jurisdictions. Could both entities maintain their strong momentum in the upcoming months? We will discuss below.
CIBC Caribbean Bank Limited (CIBC)
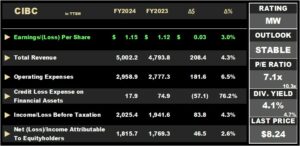
CIBC Caribbean Bank Limited (CIBC), recorded Earnings per Share (EPS) of TT$1.15 for fiscal year ended October 31st, 2024 (FY2024), up 3% relative to TT$1.12 in the prior comparable reporting period (FY2023).
Total Revenue expanded by 4.3% year on year, from TT$4.79B in FY2023 to TT$5.0B in FY2024. Operating Expenses grew to TT$2.96B from TT$2.78B, an increase of 6.5%, owing to higher strategic investment spending and employee-related costs. CIBC’s Credit Loss Expense on Financial Assets was 76.2% lower, which amounted to TT$17.9M in FY2024 versus TT$74.9M in the prior period, on account of a non-recurring account recovery in the Bahamas. Income Before Tax (PBT) stood at TT$2.03B, 4.3% higher than TT$1.94B in FY2023, with an effective tax rate of 9% compared to 10% a year earlier. The Group reported Income Tax Expense of TT$178.0M (+8.4%), leading to an overall increase in Net Income Attributable to Equity Holders by a moderate 2.6%, to TT$1.82B, from a prior TT$1.77B.
Revenue Higher
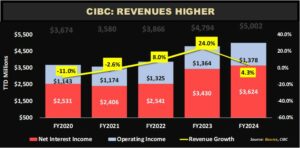
For fiscal year 2024, CIBC’s Total Revenue grew 4.3% year-on-year. Net Interest Income, the Group’s principal source of revenue (72.5%), improved by 5.7% to TT$3.62B compared to TT$3.43B in FY2023. Operating Income (27.5% of Revenue), rose by 1.0% to TT$1.38B.
In the near to medium term, the Group’s revenue may be impacted by the US benchmark rate cuts, which could be partially offset by loan volume growth.
Operating Segments Mixed
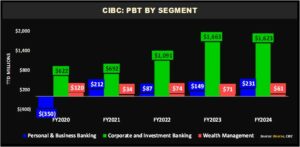
CIBC’s Profit Before Tax (PBT) reflected increased growth, an improvement of 4.3% Year over Year (YoY). The Bank’s largest contributor to PBT growth, Corporate and Investment Banking (CIB) (80.1% of PBT) reported a Profit Before Tax of TT$1.62B, a decline of 2.4% from a prior TT$1.66B. Retail, Business and International Banking (RBB) contributed 11.4% to PBT, reported a 54.4% improvement year on year from TT$149M in FY2023 to TT$231M in the current review period. The Group’s Wealth Management segment (3.0% of PBT) contracted by 14.1%, from TT$71M in FY2023 versus TT$61M in FY2024.
The Bourse View
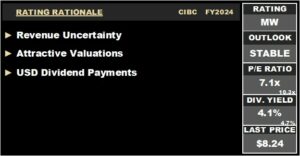
CIBC currently trades at a price of $8.24 at a trailing PE ratio of 7.1 times, below the Banking Sector average of 10.3 times. The stock offers investors a trailing dividend yield of 4.1%, below the Banking Sector average of 4.7%. The Group announced an interim dividend of US$0.0125 (TT$0.08) per share to shareholders on record dated December 27th, 2024, to be paid on January 17th, 2025. Importantly, CIBC’s dividends are paid in US Dollars.
For fiscal year 2024, CIBC surpassed historical revenue levels. On the basis of increased revenue, fairly consistent USD dividends but tempered by expected U.S interest rate cuts which will likely weigh on the Bank’s topline performance, Bourse assigns a MARKETWEIGHT rating on CIBC.
Scotiabank Trinidad and Tobago Limited (SBTT)
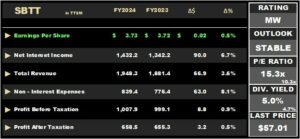
Scotiabank Trinidad and Tobago Limited (SBTT) reported Earnings per Share (EPS) of $3.73 for the full year period ending 31st October 2024, reflecting a marginal increase of 0.5% compared to $3.72 in the prior year.
SBTT’s Net Interest Income grew by 6.7% to $1.4B, while Other Income fell 4.3% from $539.2M to $516.1M in FY2024. Total Revenue for the period amounted to $1.9B, reflecting a 3.6% year-over-year growth. Non-Interest Expenses increased by 8.1%, rising from $776.4M in FY2023 to $839.4M in FY2024. SBTT reported a reduction of 4.7% in Net Impairment Loss on Financial Assets, totaling $100.9M compared to $105.9M in FY2023. Profit before Taxation rose by 0.9% to $1.0B, up from $999.1M in the last reporting period, while Income Tax Expense increased to $349.4M. Overall, the Group reported a Profit for the Period of $658.5M, a 0.5% increase from $655.3M in FY2023.
Modest Revenue Growth
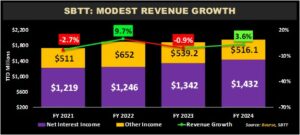
Total Revenue for SBTT increased by $66.9M, or 3.6%, reaching $1.94B compared to $1.90B in the last reporting period. Net Interest Income (73.5% of the Group’s Total Revenue) advanced 6.7% from $1.3B in FY2023 to $1.9B in FY2024. Growth was driven by the expansion of the loan portfolio in both the retail and commercial sectors. Conversely, Other Income (26.5% of Total Revenue) fell by 4.3% to $516.1M.
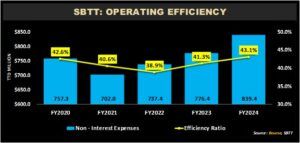
SBTT’s efficiency ratio moved from 41.3% in FY2023 to 43.1% in FY2024, with non-interest expense moving at a faster rate than total revenue. Non-interest expenses rose 8.1% from $776.4M to $839.4M, reflecting both inflationary pressures and higher business activity levels. With modest revenue growth expected, effective cost management will play a key role in determining future profitability.
Loans Increase, Impairment Expenses Fall
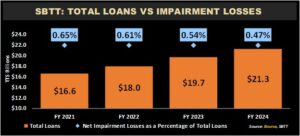
SBTT’s Total Loan Portfolio increased by 7.9%, growing from $19.7B in FY2023 to $21.3B in FY2024, driven by notable impact in the corporate and commercial segments.
Loans to Customers (97.5% of Total Loans) rose by 11.4% to $20.1B. Net Impairment Losses on financial assets were recorded at $10.1M for the current period, down 4.7%, resulting in a drop in the ratio of Net Impairment Losses of Total Loans, which fell to 0.47% in FY2024 from 0.54% in FY2023.
The Bourse View
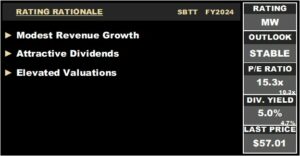
SBTT’s stock is priced at $57.01, trading at a Trailing Price to Earnings ratio of 15.3 times, which is above the banking sector average of 10.3 times. The stock provides investors with a trailing dividend yield of 5.0%, above the sector average of 4.7%. The Group has declared a final dividend payment of $0.70 per share, scheduled for payment on January 13, 2025.
With a dividend pay-out ratio of 76% and relatively stable earnings, SBTT may represent a reasonably good opportunity for income-oriented investors. This is tempered, however, by above-average sector valuations. Accordingly, Bourse maintains a MARKETWEIGHT rating on SBTT.
“This document has been prepared by Bourse Securities Limited, (“Bourse”), for information purposes only. The production of this publication is not to in any way establish an offer or solicit for the subscription, purchase or sale of any of the securities stated herein to US persons or to contradict any laws of jurisdictions which would interpret our research to be an offer. Any trade in securities recommended herein is done subject to the fact that Bourse, its subsidiaries and/or affiliates have or may have specific or potential conflicts of interest in respect of the security or the issuer of the security, including those arising from (i) trading or dealing in certain securities and acting as an investment advisor; (ii) holding of securities of the issuer as beneficial owner; (iii) having benefitted, benefitting or to benefit from compensation arrangements; (iv) acting as underwriter in any distribution of securities of the issuer in the three years immediately preceding this document; or (v) having direct or indirect financial or other interest in the security or the issuer of the security. Investors are advised accordingly. Neither Bourse nor any of its subsidiaries, affiliates directors, officers, employees, representatives or agents, accepts any liability whatsoever for any direct, indirect or consequential losses arising from the use of this document or its contents or reliance on the information contained herein. Bourse does not guarantee the accuracy or completeness of the information in this document, which may have been obtained from or is based upon trade and statistical services or other third-party sources. The information in this document is not intended to predict actual results and no assurances are given with respect thereto.”