HIGHLIGHTS
Revenue 2022/2023
- Gross Domestic Product:
- FY2022: + 1.5%
- Q12023: + 3.0%
- Revenue:
-
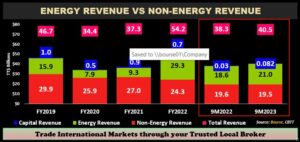
- Total Revenue ↑ 5.9% YoY, from $38.3B in 9M2022 to $40.5B in 9M2023
- Energy Revenue ↑ 12.6% YoY to $21.0B in 9M2023
- Non-Energy Revenue ↓ 0.7% YoY to $19.5B in 9M2023
- Capital Revenue ↑ 135.2% YoY
Expenditure 2022/2023
- Expenditure:
-
- Total Expenditure ↑ 14.7% YoY, from $35.2B in 9M2022 to $40.4B in 9M2023
- Current Expenditure ↑13.7% YoY
- Capital Expenditure ↑ 32.5% YoY
- Fiscal Deficit 2022/2023:
-
- Fiscal Deficit: Estimated at $6.3B
As investors and wider community eagerly await the Honourable Minister of Finance’s (MoF) delivery of T&T’s FY2023/2024 National Budget Statement today, we at Bourse consider some of the key items of the budget equation. Revenue, spending, the fiscal balance, growth, indebtedness and other factors will all be in focus as the MoF outlines the fiscal package for the upcoming year. The soon-to-be announced fiscal measures for FY23/24 will inevitably be evaluated by investors, considering the potential impact on economic fortunes, upcoming opportunities and ultimately the influence on investor confidence.
Will Real GDP Remain Positive?
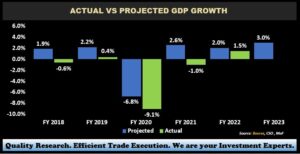
T&T’s Real Gross Domestic Product (GDP) growth has been broadly negative in recent historical periods, with the exception of FY2019 and FY2022 which experienced growth of 0.4% and 1.5% respectively. Growth rates were impacted by waning energy production and prices, in addition to the pronounced impact of the global pandemic.
The MoF would have estimated 3.0% GDP growth for both FY2023 and FY2024 in the FY22/23 budget statement. In latest developments, The CSO noted that the economy grew by 3.0% in the first fiscal quarter of 2023 when compared with the prior comparable period. IMF forecasts in April 2023 suggest T&T’s economy could grow modestly through 2024. According to the IMF, energy sector activity will support T&T economic growth of 3.2% growth in 2023.
Questions as to whether these forecasts would be realized, however, remain given the current lacklustre domestic energy production environment and softer energy commodity prices.
Revenue trends higher
Total Revenue for FY2023 – which was initially forecast to be $56.2B- was subsequently revised to $55.2B ($1B less than original estimates) in the Mid-Year Review on May 10th, 2023. In this regard, the Honourable Minister of Finance stated that while revenues from Value Added Tax (VAT) and Oil & Gas Royalties were lower than expected, there was an increase in taxes on Income and Profits from Companies other than Petroleum Companies.
Despite tepid energy production, Total Revenue for the first nine months of fiscal 2022/2023 (9M 2022/2023) – based on data from the Central Bank of Trinidad and Tobago (CBTT)- actually increased 5.9% from $38.3B in 9M 2021/2022 to $40.5B. Data for 9M 2022/2023 revealed Energy Revenue of $21.0B, up 12.6% from $18.6B reported in the prior comparable nine-month period. Non-Energy Revenue, meanwhile, was fairly flat across comparable periods, falling 0.7% from $19.6B to $19.5B in 9M 2022/2023.
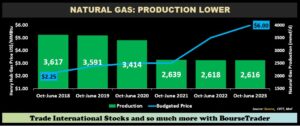
At the domestic energy production level, the MoF in the FY2023 Budget Statement forecast Natural Gas production to be just under 3.0 bcfd in 2023. Based on data available from the Ministry of Energy and Energy Industries (MEEI), there has been little progress on the production front, with current gas production averaging around 2.6 bcfd for 9M 2022/2023, relatively consistent with the prior comparable period. No production forecast for crude oil was provided during the reading of the FY2023 budget. Available production data for the 9M 2022/2023 suggests that daily crude oil production in T&T averaged just under 57,000 barrels per day (bopd). On the pricing side, Brent Crude oil and WTI Crude Oil prices have averaged US$82.33/barrel and $77.16/barrel respectively. This contrasts with the budgeted oil price of $92.50/barrel. The FY2023 budget was premised on average natural gas prices of US$6.00/MMBtu, with energy revenues expected to contribute 44.5% of Total Revenue in FY2023. According to the MoF, the budgeted price of natural gas is based on the netback prices of three natural gas benchmarks: Henry Hub (US), European NBP (Natural Balancing Point) and Japan/Korea benchmark (JKM).
Looking at gross reference benchmark levels of natural gas, prices have averaged US$5.90/MMBtu year-to-date, suggesting that netback pricing may have been below budget.
Expenditure Side of the Equation
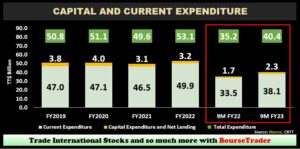
Total Expenditure for FY2023 was initially estimated to be $57.7B, revised upward by $3.8B to $61.5B at the mid-year review. Current Expenditure, the major component of Total Expenditure, is usually recurrent in nature and non-capital forming. Capital Expenditure, on the other hand, focuses on long-term asset formation. Current Expenditure accounted for roughly 94% of Total Expenditure over the past 5 years, whereas Capital Expenditure accounted for the outstanding 6%. The allocations of current and capital expenditure remained fairly consistent during the first 9M 2022/2023. Current Expenditure amounted to $38.1B in 9M FY23 (94% of Total Expenditure) compared to $33.5B in 9M 2021/2022, while Capital Expenditure amounted to $2.3B versus $1.7B in the prior comparable period.
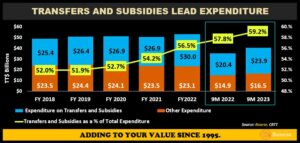
Much of Total Expenditure has also been focused on Transfer & Subsidies, accounting for 53.5% of Total Expenditure on average from FY2018-FY2022. Transfers & Subsidies as a % of Total Expenditure has been increasing, rising from 52% in FY2018 to 56.5% in FY2022. At 9M 2022/2023, Transfer & Subsidies accounted for 59.2% of Total Expenditure. This is an area which may come under increasing scrutiny, especially in circumstances of lower Revenue.
A Wider Fiscal Deficit?
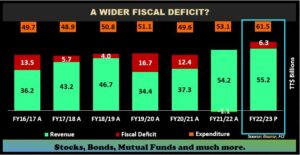
Notwithstanding higher Total Revenue at the 9M 2022/2023 point, a more-than-proportionate increase in forecast Total Expenditure is anticipated to widen the Fiscal Deficit projection increased from the initial $1.5B to $6.3B. Historically, the Fiscal Deficit has averaged 4.5% of GDP over the last 10 years (FY2013-2022), with the current fiscal deficit (FY23) currently projected at approximately 4.1% of GDP.
Fiscal Deficit Funding Options

With the higher likelihood of a wider fiscal deficit/gap, the Government would turn to its three main available options: (i) Dipping into Savings (HSF), (ii) Borrowing (Issue Debt) and/or (iii)Asset Monetization.

Dipping into savings could involve withdrawals from the Heritage and Stabilization Fund, subject to the criteria set out in Section15 and 15A of the HSF act. The conditions for withdrawal states “where the petroleum revenues collected in any financial year fall below the estimated petroleum revenues for that financial year by at least ten per cent, withdrawals may be made from the Fund.” According to the latest media release from the MoF, the Net Asset Value (NAV) of the Heritage and Stabilization Fund (HSF) stood at US$5.46 B (TT$37.2 B) as at June 9, 2023. This represents an increase in NAV of US$327M (TT$2.2B) from December 2022. Excluding the last deposit made in December 2022 of US$182M, the fund generated comprehensive income of approximately US$0.6B over the 9-month period September 2022 to June 2023. As energy price volatility continues, a drop in energy revenue of 10% below budgeted revenues could create an avenue for a possible withdrawal from the HSF.
Borrowing remains a viable option for the Government to raise funds to finance the deficit, with several TTD private placements in 2023 issued either for (i) refinancing objectives or (ii) for budgetary expenses. In September 2023, the Government of the Republic of Trinidad and Tobago (GORTT) accessed international markets to raise US$560M at an average annual interest cost of 5.95%. The proceeds of fundraising would be utilized to repay an outstanding USD bond, which pays 4.375% and matures in January 2024. Ultimately, GORTT is confronting a higher USD interest rate environment, which would make it more costly to borrow in the immediate term. According to the Central Bank of Trinidad and Tobago (CBTT), T&T’s Debt: GDP ratio – as measured by the Adjusted General Government Debt to GDP Ratio – declined to 66.5% in FY2022 then rose to 68.2% in June 2023, with a new ‘soft debt-to-GDP limit’ of 75% for FY2023 and FY2024. It remains to be seen if this target would be realized.
Monetization of Assets is another avenue which GORTT could pursue for deficit funding. Monetization could include the outright sale of state-owned assets/holdings. It could also involve the utilization of state assets, in an appropriate financing vehicle, as collateral for the raising of borrowed funds. A relatively recent example of the latter would be the National Investment Fund (NIF) series of bonds, which utilised a collection of publicly-listed and private assets as collateral for three series of bonds. While potential Initial Public Offerings (IPOs) and other asset monetization initiatives have been mentioned unofficially or without a concrete timeline, the investor community would be listening to this budget for any opportunities which could ultimately broaden the domestic investment menu.
As always, the budget statement sets the tone for economic and investor expectations in the year ahead. We would like to take this opportunity to wish the Minister of Finance a successful delivery in the reading of the Fiscal 2023/2024 budget.
“This document has been prepared by Bourse Securities Limited, (“Bourse”), for information purposes only. The production of this publication is not to in any way establish an offer or solicit for the subscription, purchase or sale of any of the securities stated herein to US persons or to contradict any laws of jurisdictions which would interpret our research to be an offer. Any trade in securities recommended herein is done subject to the fact that Bourse, its subsidiaries and/or affiliates have or may have specific or potential conflicts of interest in respect of the security or the issuer of the security, including those arising from (i) trading or dealing in certain securities and acting as an investment advisor; (ii) holding of securities of the issuer as beneficial owner; (iii) having benefitted, benefitting or to benefit from compensation arrangements; (iv) acting as underwriter in any distribution of securities of the issuer in the three years immediately preceding this document; or (v) having direct or indirect financial or other interest in the security or the issuer of the security. Investors are advised accordingly. Neither Bourse nor any of its subsidiaries, affiliates directors, officers, employees, representatives, or agents, accepts any liability whatsoever for any direct, indirect or consequential losses arising from the use of this document or its contents or reliance on the information contained herein. Bourse does not guarantee the accuracy or completeness of the information in this document, which may have been obtained from or is based upon trade and statistical services or other third-party sources. The information in this document is not intended to predict actual results and no assurances are given with respect thereto.”