HIGHLIGHTS
AMBL 9M2023
- Earnings: Earnings Per Share of $1.12, up 160.5% from Loss Per Share of $1.85
- Performance Drivers
- Higher Revenues
- Acquisition Activity
- Outlook:
- Elevated Valuations
- Rating: Maintained at MARKETWEIGHT
JMMBGL HY2023
- Earnings: Earnings Per Share of TT$0.04 increase from Loss Per Share of TT$0.09
- Performance Drivers:
- Higher Share of Profit from Associate
- Lower Net Interest Income
- Higher Operating Expenses
- Outlook:
- Uncertain financial markets
- Elevated Interest Rates
- Rating: Assigned as UNDERWEIGHT
This week, we at Bourse review the performance of Non-Banking Finance sector stocks ANSA Merchant Bank Limited (AMBL) and JMMB Group Limited (JMMBGL) and for the nine-month and six-month periods ending September 30th, 2023. JMMBGL’s performance was supported by an increase in Share of Profit from its Associated Company, while AMBL reported increased revenue growth and improved operating margins. How will both companies fare in the months ahead given the still uncertain operating environment? We discuss below.
ANSA Merchant Bank Limited (AMBL)
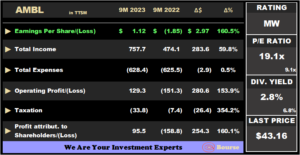
AMBL reported an Earnings Per Share (EPS) of $1.12 or a 160.5% increase for the nine-month period ending September 30, 2023 (9M2023), compared to the preceding period’s Loss Per Share (LPS) of $1.85 (9M2022).
Total Income increased 59.8%, from $474.1M in 9M2022 to $757.7M in 9M2023. Total Expenses rose 0.5% YoY to $628.4M. As a result, Operating Profit grew to $129.3M in 9M2023, compared to an Operating Loss of $151.3M in the previous comparable quarter. Taxation expense increased to $33.8M, in contrast to 7.4M in the prior comparable period. Overall, a Profit Attributable to Shareholders was $95.5M, relative to a Loss of $158.8M in 9M2022.
PBT Expands
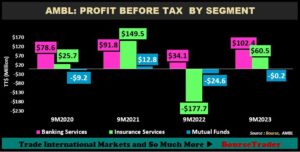
AMBL reported a Profit Before Tax of $129.3M for the nine months ended September 30, 2023, compared to a Loss Before Tax of $151.3M for the same period previous year.
Banking Services PBT increased 200.0% YoY, from $34.1M to $102.4M in 9M2023, according to AMBL propelled by increased segmental revenue, higher lending, and trading operations as well as a strong investment portfolio.
The Insurance Services segment, which includes TATIL, TATIL Life, Trident, and Colfire, contributed $60.5M to PBT, compared to a loss of $177.7M in 9M2022. According to the Group, the acquisition of Colfire in April 2023 delivered commendable performance.
The Mutual Funds segment reported a smaller loss of $249K for the period, after a $24.6M loss in 9M2022 and experienced a 20.2% decline in segmental revenue.
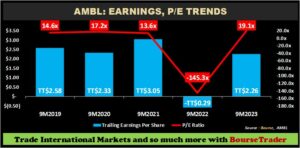
AMBL reported an EPS of $1.12 in the current reporting quarter, marking an increase from a Loss Per Share in 9M2022, a period during which the Bank was impacted by non-cash mark-to-market losses on account of volatile financial markets. The Group’s trailing 12-month EPS stood at $2.26 in 9M2023, with AMBL’s Price-to-Earnings (P/E) currently stands at 19.1 times.
The Bourse View
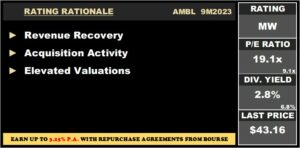
AMBL is currently priced at $43.16, with a trailing dividend yield of 2.8%, lower than the Non-Banking Sector average of 6.8%. The stock trades at a P/E ratio of 19.1 times, above the sector average of 9.1 times. On the basis of revenue recovery, supported by acquisition activity but tempered by elevated valuations and the impact of non-cash mark-to-market volatility on earnings clarity, Bourse maintains a MARKETWEIGHT rating on AMBL.
JMMB Group Limited (JMMBGL)
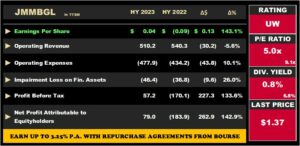
JMMB Group Limited (JMMBGL) reported an Earnings Per Share (EPS) of TT$0.04 for its six months ended September 30th, 2023 (HY2023), compared to a loss per share of TT$0.09 in the prior comparable period.
Net Interest Income narrowed 27.1% from TT$248.5M to TT$181.1M. Fee and Commission Income decreased by 12.8%, from TT$136.7M to TT$119.2M. Gains from Securities Trading reported climbed 80.8%, from TT$80.3M (HY2022) to TT$145.1M (HY2023). Foreign exchange margins from Cambio Trading came in at TT$58.5M in HY2023, declining 17.2% over the previous period. Consequently, Operating revenue fell 5.6% year on year (YOY) from TT$540.3M in HY2022 to TT$510.2M in HY2023. Operating Expenses rose 10.1% to TT$477.9M increasing the Group’s efficiency ratio from 80.4% to 93.7% in HY2023. Impairment Loss on Financial Assets grew 26% from TT$36.8M in the preceding comparable quarter (HY2022). The Group’s Share of Profit of Associate amounted to TT$70.3M, a welcome turnaround from a prior loss of $241.1M, resulting in an increase in Profit Before Tax of TT$83.6M. Taxation swung from a loss of $7.0M to a credit of TT$26.4M, leading to resulting Profit for the period of TT$83.6M in HY2023, compared to a deficit of TT$177.1M in HY2022. Overall, JMMBGL’s Profit Attributable to Equity Holders stood at TT$79.0M, compared to a loss of TT$183.9M in the previous period.
PBT Improves on Associate Share of Profit
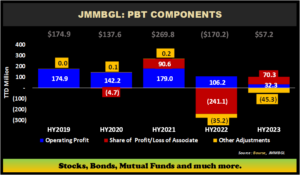
JMMBGL’s Profit before Tax (PBT) grew to TT$57.2M from a loss of TT$170.2M for the six months ended September 30th, 2023. Operating Profit declined roughly 70% from TT$106.2M in HY2022 to TT$32.3M in HY2023, propelled by the challenging operating environment as global interest rates continue to remain high.
JMMBGL’s 23.4% Share of Profit of Associate company Sagicor Financial Company Limited (SFC) – amounting to TT$70.3M – more than offset net losses from the Group’s core business (inclusive of other income and impairment losses on financial assets). This share of profit was a stark change from the share of SFC loss in the prior comparable period, which amounted to TT$241.1M. According to the Group, this performance was driven by changes in actuarial liability assumptions, as well as the adoption of IFRS 17 in April 2023.
Operating Profits Decline
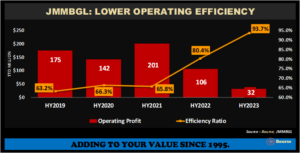
JMMBGL’s efficiency ratio increased from 80.4% in HY2022 to 93.7% in HY2023, reflecting reduced operational efficiency as shown by the drop in Operating Profits to TT$32M. It suggests that a higher proportion of the company’s revenue (net of interest expense) is being used to cover operating expenses (lower ratio represents better performance). Operating expenses increased from TT$434.1M to TT$477.9M, reflecting inflationary increases and strategic spending on its longer-term initiatives. It remains to be seen how well the Group can manage its non-interest costs moving forward to improve operating efficiency.
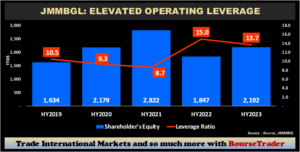
After declining from HY2019 to HY2021, JMMBGL’s financial leverage (measured as Total Assets divided by Total Shareholder Equity) was 13.7 times in the most recently concluded period. This represents an improvement, however, from the 15.0x level in HY2022. After reaching a high of TT$2.8B in HY2021, Shareholder Equity declined to TT$2.2B in HY2023. Higher financial leverage implies a higher level of financial risk, with increased sensitivity of the Group’s equity value to the price movement of assets which it holds.
The Bourse View

JMMBGL currently trades at a market price of $1.37 and trades at a P/E ratio of 5.0 times, below the sector average of 9.1 times. The stock offers investors trailing dividend yield of 0.8%, below the Non-Banking Finance sector average of 6.8%.
The Group continues to be impacted by the challenging economic conditions as a result of the still-elevated interest rate environment and inflationary pressures. With US interest rates expected to have peaked and eventually head lower, Interest spreads may be set to recover. On the basis of reduced revenues, lower operational efficiency and uncertain financial markets which could weigh on investment securities, Bourse assigns an UNDERWEIGHT rating to JMMBGL.
“This document has been prepared by Bourse Securities Limited, (“Bourse”), for information purposes only. The production of this publication is not to in any way establish an offer or solicit for the subscription, purchase, or sale of any of the securities stated herein to US persons or to contradict any laws of jurisdictions which would interpret our research to be an offer. Any trade in securities recommended herein is done subject to the fact that Bourse, its subsidiaries and/or affiliates have or may have specific or potential conflicts of interest in respect of the security or the issuer of the security, including those arising from (i) trading or dealing in certain securities and acting as an investment advisor; (ii) holding of securities of the issuer as beneficial owner; (iii) having benefitted, benefitting or to benefit from compensation arrangements; (iv) acting as underwriter in any distribution of securities of the issuer in the three years immediately preceding this document; or (v) having direct or indirect financial or other interest in the security or the issuer of the security. Investors are advised accordingly. Neither Bourse nor any of its subsidiaries, affiliates directors, officers, employees, representatives, or agents, accepts any liability whatsoever for any direct, indirect, or consequential losses arising from the use of this document or its contents or reliance on the information contained herein. Bourse does not guarantee the accuracy or completeness of the information in this document, which may have been obtained from or is based upon trade and statistical services or other third-party sources. The information in this document is not intended to predict actual results and no assurances are given with respect thereto.”

