HIGHLIGHTS
SBTT 9M 2021
- Earnings: EPS 26.2% higher from $2.08 to $2.62
- Performance Drivers:
- Lower Revenue
- Increased Efficiency
- Lower Net Impairment Loss on Financial Assets
- Outlook:
- Constrained Revenue Growth
- Gradual Economic Recovery
- Rating: Maintained at NEUTRAL.
FCI 9M 2021
- Earnings: EPS up 300% from a Loss Per Share of TT$(0.19) to TT$0.38
- Performance Drivers:
- Lower Revenue
- Absence of Impairment of Intangible Assets
- Reduced Credit Loss Expenses
- Outlook:
- Stabilizing Financial Markets
- Economic Uncertainty
Rating: Maintained at NEUTRAL
This week, we at Bourse review the financial performance of two Canadian-owned Banking stocks FirstCaribbean International Bank Limited (FCI) and Scotiabank Trinidad and Tobago Limited (SBTT) for the nine-month period ended July 31st, 2021. Both groups recorded improvement in earnings, despite also reporting lower revenues. Could this trend continue? We discuss below.
Scotiabank Trinidad and Tobago Limited (SBTT)
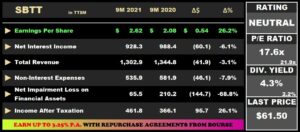
Scotiabank Trinidad and Tobago Limited (SBTT) reported earnings per share (EPS) of $2.62 for the nine-month period ended July 2021 (9M 2021), a 26.2% increase compared to $2.08 in the prior comparable period. Net Interest Income declined 6.1% to $928.3M while Other Income showed a modest increase of 5.1% from $356.4M in 9M 2020 to $374.6M in 9M 2021. Total Revenue for 9M 2021 came in at $1.3B, a 3.1% decrease from the prior period as the Bank continues to be affected by the challenging economic environment. Non-Interest Expenses shifted 7.9% lower from $581.9M in 9M 2020 to $535.9M in 9M 2021 as the Bank focused on improving operating efficiency. SBTT recorded a 68.8% contraction in Net Impairment Loss on Financial Assets, amounting to $65.5M (9M 2020: $210.2M). The Bank’s decline in expenses was able to offset the decline in revenue, resulting in an Income Before Tax of $701.5M, 26.9% higher than $552.6M reported in 9M 2020. Overall, SBTT reported Income After Tax of $461.8M, up 26.1% compared to $366.1M in 9M 2020.
Revenues Lower
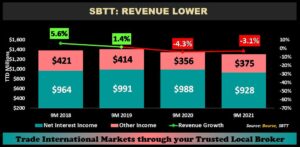
SBTT’s Revenue continued the downward trend from 9M 2020, albeit at a slower rate of 3.1% compared to 4.3% in the prior period. As economic pressures continue to linger, Net Interest Income declined 6.1% from $988M in 9M 2020 to $928M in 9M 2021. Other Income was relatively more resilient, increasing 5.1% from $356M in 9M 2020 to $375M in 9M 2021. The Bank’s largest operational segment by revenue, Retail Corporate and Commercial Banking (90.5% of Total Revenue) declined 3.1% year-over-year. SBTT’s Asset Management Segment increased 4.9% while it’s Insurance Services Segment declined 3.7%.
Dividend Payout Increases
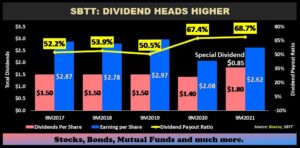
Notwithstanding SBTT’s marginal volatility in EPS, the Bank has maintained a consistent dividend of $1.50 from 9M 2017 to 9M 2019 with an average payout ratio of 52.3%. As a result of reduced earnings in 9M 2020 and 9M 2021, the Bank’s payout ratio expanded above its historical average. A positive growth trend in dividends is typically welcomed by investors, providing a steady stream of income. The Bank’s special dividend of $0.85 pushed total Dividends Per Share to $2.65 (payout ratio 101.1%). Nevertheless, SBTT’s payout ratio excluding the special dividend (69%: 9M 2021) has been consistently higher than the Banking Sector’s average of 36%.
Investment Assets Grow
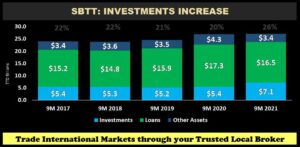
SBTT Loans to Customers decreased 4.4% over the period as economic activity remained subdued. In perhaps an effort to offset the decline in loans to customers, SBTT increased investments by 32.3% from $5.4B in 9M 2020 (20% of total assets) to $7.1B in 9M 2021 (26% of total assets). Investments in Treasury Bills increased 16.2% to $4.0B in 9M 2021 from $3.5B in 9M 2020, while Investment Securities increased 61.8% to $3.1B in 9M 2021 from $1.9B in 9M 2020.
The Bourse View

SBTT is currently priced at $61.50, up 6.0% year-to date. The stock trades at a Trailing Price to Earnings ratio of 17.6 times, below the Banking Sector average of 21.9 times. SBTT declared an interim dividend of $0.60 per share as well as a special dividend of $0.85 per share both payable on October 4th 2021. The stock offers investors a Trailing Dividend Yield of 4.31% (5.9% inclusive of the special dividend), above the sector average of 2.2%. On the basis of consistent dividend payments, but tempered by lingering economic challenges, Bourse maintains a NEUTRAL rating on SBTT.
FirstCaribbean International Bank Limited (FCI)

FCI reported an Earnings Per Share (EPS) of TT$0.38 for the nine-months ended 31st July, 2021 (9M 2021), as compared to a Loss per Share (LPS) of TT$0.19, in the previous year.
Total Revenue amounted to TT$2.8B, 6.2% lower Year on Year (YoY), while Operating Expenses marginally declined 1.5% from TT$2.04B to TT$2.01B. Credit Loss Expense on Financial Assets moderated, moving from a loss TT$857.2M to a Loss of TT$101.9M. Consequently, the Bank reported an Income Before Taxation of TT$654.6M as compared a Loss Before Tax (LBT) of TT$291.2M in 9M 2020. Overall, Net Income for the Period amounted to TT$288.4M relative to the Net Loss for the Period of TT$43M in the previous year, mainly due to lower provisions for credit losses. Net Income attributable to Equity holders was reported at TT$592.8M, TT$886.9M higher than the comparable period.
Revenue Slips
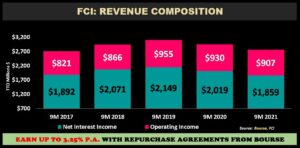
FCI’s Total Revenue trended lower in 9M 2021 and 9M 2020, after increasing for 3 consecutive periods, declining 6.2% YoY. Net Interest Income, FCI’s largest revenue contributor (9M 2021 Revenue: 67%) contracted 7.9% YoY. With FCI’s primary operating jurisdictions being heavily dependent on Tourism, demand for and the ability to qualify for loans may continue to be constrained, which could weigh on FCI’s top line. Similarly, Operating Income consisted of 33% of revenue in 9M 2021, and declined 2.5% marginally from TT$930M to TT$907M. The Bank may face continued pressures impacted by narrower margins, as a result of an environment of lower disposable income and sluggish economic activity.
Segment Performance Mixed

Notwithstanding a 6.2% decline in Total Revenue, FCI’s PBT expanded by 124.8% during the period primarily owing to the absence of Impairment Costs and significantly lower Credit Loss Expense on Financial Assets.
FCI’s Corporate and Investment Banking (CIB) segment reported a Profit Before Tax of TT$555M, 48.1% higher YoY. Retail, Business and International Banking (RBB) recorded a Profit Before Tax of TT$41M in 9M 2021, a recovery from a Loss of TT$209M in the prior comparable period. Wealth Management recorded a decline in performance from TT$110 to TT$20M. Notably, the segments continued to be affected by the economic impact of the pandemic.
The Bourse View
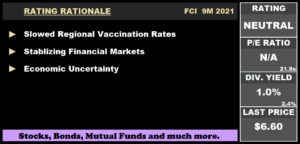
FCI is currently priced at $6.60 and trades at a market to book ratio of 1.5 times relative to a sector average of 2.1 times. The Group has declared an interim dividend of TT$0.07 for this 9M 2021, to be paid on October 8th, 2021. The stock currently has a trailing dividend yield of 1.0% below the sector average of 2.4%.
The improving financial market conditions in the Group’s operating jurisdictions and (slow) economic reopening’s could provide continued recovery to FCI’s financial performance. However, the region, like the broader global environment, continues to grapple with uncertainty related to the pandemic. On the basis of, stabilizing financial markets, but tempered by slowed regional vaccination rates and economic uncertainty, Bourse maintains a NEUTRAL rating on FCI.
“This document has been prepared by Bourse Securities Limited, (“Bourse”), for information purposes only. The production of this publication is not to in any way establish an offer or solicit for the subscription, purchase or sale of any of the securities stated herein to US persons or to contradict any laws of jurisdictions which would interpret our research to be an offer. Any trade in securities recommended herein is done subject to the fact that Bourse, its subsidiaries and/or affiliates have or may have specific or potential conflicts of interest in respect of the security or the issuer of the security, including those arising from (i) trading or dealing in certain securities and acting as an investment advisor; (ii) holding of securities of the issuer as beneficial owner; (iii) having benefitted, benefitting or to benefit from compensation arrangements; (iv) acting as underwriter in any distribution of securities of the issuer in the three years immediately preceding this document; or (v) having direct or indirect financial or other interest in the security or the issuer of the security. Investors are advised accordingly. Neither Bourse nor any of its subsidiaries, affiliates directors, officers, employees, representatives or agents, accepts any liability whatsoever for any direct, indirect or consequential losses arising from the use of this document or its contents or reliance on the information contained herein. Bourse does not guarantee the accuracy or completeness of the information in this document, which may have been obtained from or is based upon trade and statistical services or other third party sources. The information in this document is not intended to predict actual results and no assurances are given with respect thereto.”
