| HIGHLIGHTS GKC 9M 2020 · Earnings: EPS increased 35.3% from TT$0.21 to TT$0.15 · Performance Drivers: o Revenue Growth ▲ o 65% Acquisition of Key Insurance ▲ o Improved Margins ▲ o Impairment Losses on Financial Assets ▼ · Outlook: o Possibly Higher Margins o Revenue Resilience · Rating: Maintained at NEUTRAL.
AGL FY 2020 · Earnings: EPS rose 4.0% from $1.83 to $1.76 · Performance Drivers: o Pandemic influenced Pharmaceutical & FMCG Demand ▲ o Improved Margins ▲ · Outlook: o Essential Product Offerings Supporting Stable Revenue Growth o Potential Continuation of Strengthened Margins · Rating: Maintained at NEUTRAL. |
GraceKennedy, Agostini’s Grow in Pandemic
This week, we at Bourse review the financial performance of GraceKennedy Limited (GKC) for the nine-month period and Agostini’s Limited (AGL) for the full year both ended 30th September, 2020. Bucking the broad trend across most publicly-listed companies, GKC and AGL reported improved performance under the prevailing pandemic conditions. Could this persist, or will their performance return to ‘normal’? We discuss below.
GraceKennedy Limited
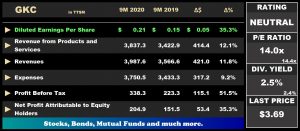
GKC recorded Earnings per Share (EPS) of TT$0.21 for the nine months ended September 30th 2020 (9M 2020), a 35.3% increase from the EPS of TT$0.15 in the previous period. Revenue from Products and Services advanced 12.1% to TT$3.84B from TT$3.42B while Interest Revenue grew 4.6% to $150.3M. Total Revenue amounted to TT$4.0B, 11.8% higher than TT$3.6B in the prior period. Direct and Operating Expenses increased 8.9% while Net Impairment Losses on Financial Assets expanded by 73.8% to TT$29.2M, impacted by adverse economic conditions. Resultantly, Total Expenses climbed 9.2%. Other Income recorded a 17.8% increase, amounting to $105.1M. Profit from Operations advanced 53.7% ($119.6M) moving to $342.2M from $222.6M, as an expansion of revenue stream outweighed the increase in costs. Interest Income from Non-Financial Services was up 8.8% to $16.3M. Interest Expense from Non-Financial Services also increased by 10.8% to $39.1M. Shares of Results of Associates and Joint Ventures fell 9.7% to $19.0M from a previous $21.0M. Profit Before Tax was $338.3M, up 51.5% from $223.3M in 9M 2019. Net Profit for the Period was $228.5M, 32.9% up from a prior $171.9M. Overall, Profit Attributable to Shareholders of GraceKennedy Limited was $204.9M, 35.3% higher than $151.5M in the prior comparable period.
Profits Resilient
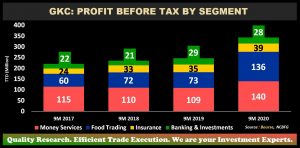
GKC’s Profit Before Tax (PBT) has consistently trended upwards from 9M 2017 to 9M 2020 with a Compounded Annual Growth Rate (CAGR) of 12%. Money Services, the largest contributor to PBT (41%) amounted to TT$140M, a 28% year on year improvement owing to its Jamaica and Guyana markets. The segment saw a 220% increase in digital customer registration whilst its Western Union digital transactions increased by 400%, attributed to the acceleration of the use of digital medium to facilitate transactions in the socially restricted environment.
Food Trading, which accounted for 79% of GKC’s Revenue but only 40% of PBT, expanded 86% YoY. GKC recorded improvements across its 3 Food Trading segments, Manufacturing, Distribution and Retail, buoyed by higher demand locally and internationally. This, coupled with an expansion of distribution channels and improved operating margins, fuelled the segment’s PBT of TT$136M. Whilst the essential nature of GKC’s product offerings is expected to provide resilience in an economically challenged environment, reinstated lockdown measures in Europe, which accounted for 13% of The Group’s Revenue in FY 2019, could create some headwinds to GKC’s export operations in this region.
The Insurance Segment consistently increased from 9M 2017 to 9M 2020 and recorded a 10% YoY increase in the current period, primarily driven by the GKC’s 65% acquisition of Key Insurance in March 2020. Despite experiencing an 11% and 9% increase in Loans and Deposits (respectively), the Banking and Investment segment (8% of PBT) contracted by 6%, owing to higher impairment losses and reduced finance income.
Margins Improve
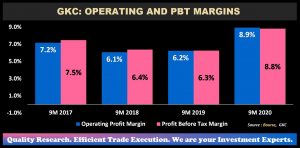
GKC’s Operating Margins have fluctuated from 9M 2017 to 9M 2020. Operating Profit Margin improved from 6.2% to 8.9% in 9M 2020, reflecting GKC’s more efficient approach to managing its operating expenses. Looking forward, The Group continues to seek improvement in its operational efficiency and explore strategic partnership opportunities. Among other initiatives, GKC formalized an agreement with Nestlé to produce Nestlé’s Everyday Milk Powder. Similarly, the completion of the construction of GKC’s new warehouse in Jamaica may further reduce overhead costs in the coming periods. The Profit Before Tax Margin followed suit, moving from 6.3% to 8.8% in the current period.
The Bourse View
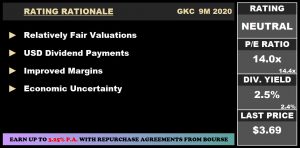
At a current price of $3.69, GKC trades at a trailing P/E of 14.0 times, marginally lower than the Conglomerate sector average of 14.4 times. GKC offers investors a trailing dividend yield of 2.5%, relatively in line with the sector average of 2.4% and has declared an Interim Dividend of JMD$0.55 (USD$0.0035), payable on December 15th 2020. The major question on the minds of investors will be the sustainability of GKC’s performance post-pandemic. With vaccine progress accelerating and economies raring to reopen, GKC’s future performance could be affected by the reversion to ‘normal’ consumption patterns. On the basis of USD dividend payments, continued revenue growth and ongoing margin improvements, but tempered by economic pressures in its primary operating jurisdiction, Bourse maintains a NEUTRAL rating on GKC.
Agostini’s Limited
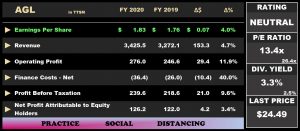
Agostini’s Limited, for its financial year ended the 30th September, 2020 generated an Earnings Per Share of $1.83, 4.0% greater than $1.76 in the prior comparable period.
Revenue from Contracts with Customers grew 4.7% within the year moving from $3.27B to $3.43B. Operating Profits rose a noteworthy 11.9% to $276.0M from a prior $246.6M. Finance Costs, was $10.4M higher at $36.4M or a 40% increase from the previous year. Profit Before Taxation was 9.6% higher at the ended of FY 2020 moving from $218.6M to $239.6M. Taxation Expense was $14.8M or 26.6%, higher at $70.5M. Profit Attributable to Owners of the Parent was $126.2M, 3.4% up from $122.0M in FY 2019.
Pharma, FMCG Segments Thrive
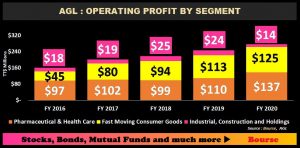
Pharmaceuticals & Healthcare (Pharma) accounted for roughly 50% of Total Operating Profit in FY 2020. Notably, the segment grew a significant 25.3% from the prior year, moving from $109.6M to $137.3M. The COVID-19 pandemic spurred demand for pharmaceuticals and strengthened the performance of subsidiary entities Smith Robertson and SuperPharm. Smith Robertson, which operates as a pharmaceutical and personal care distributor, also benefitted from increased purchases from the Ministry of Health.
Fast Moving Consumer Goods (FMCG) comprised a further 45% of Operating Profit in FY 2020, generating an Operating Profit of $124.9M or 10.4% greater than period year. Stay at home measures would have been a likely influencing factor of the growth rate in this segment, as consumers shifted their demand to at home food consumption. The FMCG segment involves the distribution of packaged food products, beverages and home care products by the Group through its Joint Venture, Caribbean Distribution Partners Limited and its underlying subsidiaries including Hand Arnold, VEMCO, VEMBEV. Key brands distributed by the Group include household cleaning brands ‘Clorox’, ‘Pine-Sol’ and ‘Klene Bleach’ which likely saw elevated demand amid the COVID-19 pandemic.
Industrial, Construction and Holdings was the only segment adversely affected as shocks to the economy lead to reduced construction activities. Additionally, the Group’s exposure to the energy sector, through its ownership of Rosco Petrovance, also led to a decline in the segment’s performance on account of lower liquefied natural gas prices.
Margins Improve
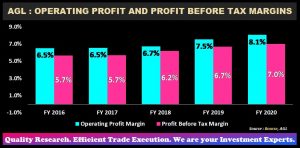
Operating Profit Margin moved from 7.5% in FY 2019 to 8.1% in FY 2020, continuing the positive trend which the Group has delivered since FY2`016. The strengthening of the Group’s Operating Profit relative to prior year also filtered into the Profit Before Tax Margin which rose to 7.0% relative to a previous 6.7%.
The Bourse View
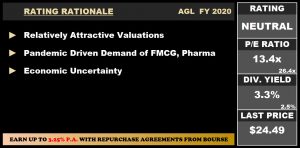
AGL is priced $24.49 and currently trades at a price to earnings ratio of 13.4 times relative to a sector average of 26.4 times. On the 27th of November, AGL declared a final dividend of $0.55 payable on the 26th of January, paying a total dividend for FY 2020 of $0.80 relative to $0.79 in the prior year. AGL currently offers shareholders a trailing dividend yield of 3.3% compared to a sector average of 2.5%. Due to the essential nature of products offered by AGL, the Group was able to record persistent top line growth. Like GKC, AGL may have to navigate ‘normalizing’ demand patterns as pandemic conditions recede. This, in turn, could have an impact on operating margins. In the near future, however, demand for cleaning products and pharmaceuticals is expected to remain elevated. On the basis of fair valuations and improved margins, but tempered by the potential headwinds from current economic conditions and the likelihood of eventual demand normalization, Bourse maintains a NEUTRAL rating on AGL.
“This document has been prepared by Bourse Securities Limited, (“Bourse”), for information purposes only. The production of this publication is not to in any way establish an offer or solicit for the subscription, purchase or sale of any of the securities stated herein to US persons or to contradict any laws of jurisdictions which would interpret our research to be an offer. Any trade in securities recommended herein is done subject to the fact that Bourse, its subsidiaries and/or affiliates have or may have specific or potential conflicts of interest in respect of the security or the issuer of the security, including those arising from (i) trading or dealing in certain securities and acting as an investment advisor; (ii) holding of securities of the issuer as beneficial owner; (iii) having benefitted, benefitting or to benefit from compensation arrangements; (iv) acting as underwriter in any distribution of securities of the issuer in the three years immediately preceding this document; or (v) having direct or indirect financial or other interest in the security or the issuer of the security. Investors are advised accordingly. Neither Bourse nor any of its subsidiaries, affiliates directors, officers, employees, representatives or agents, accepts any liability whatsoever for any direct, indirect or consequential losses arising from the use of this document or its contents or reliance on the information contained herein. Bourse does not guarantee the accuracy or completeness of the information in this document, which may have been obtained from or is based upon trade and statistical services or other third party sources. The information in this document is not intended to predict actual results and no assurances are given with respect thereto.”

