
HIGHLIGHTS
MASSY HY2025
- Earnings: Earnings Per Share 23.8% higher
Continuing Operations: EPS 21.7% higher, from $0.14 to $0.17
- Performance Drivers:
- Revenue Growth
- Higher Margins
- Outlook:
- Geographical Diversification
- Acquisition Integration Efforts
- Rating: Maintained at OVERWEIGHT
GKC Q12025
- Earnings: Diluted Earnings Per Share 3.2% higher, from TT$0.095 to TT$0.098
- Performance Drivers:
- Revenue Growth
- Lower Margins
- Outlook:
- Acquisition Integration Efforts
- Rating: Maintained at MARKETWEIGHT
This week, we at Bourse review the performance of two members of the Conglomerate sector on the Trinidad & Tobago Stock Exchange (TTSE), Massy Holdings Limited (MASSY) and Grace Kennedy Limited (GKC) for their six-months period (HY2025) and three-months (Q12025) ended March 31st, 2025, respectively. Massy and GKC delivered improved performance driven by increased revenues. Can both companies continue its positive earnings momentum? We discuss below.
Massy Holdings Limited (MASSY)
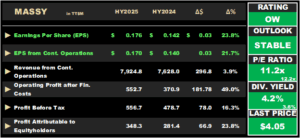
Massy Holdings Limited (MASSY) reported Earnings per Share (EPS) of $0.176 for the six months period ended March 31st, 2025 (HY2025), 23.8% higher than the $0.142 reported in HY2024. EPS from Continuing Operations grew 21.7% from $0.140 to $0.170 per share.
Revenue from Continuing Operations grew 3.9% YoY, from $7.63B in HY2024 to $7.92B in HY2025. Operating Profit after Finance Costs increased 49.0% to $552.7M in the current period from $370.9M in HY2024. Share of Results of Associates and Joint Ventures declined 96.3% to $4.0M (HY2024: $107.8M). Profit Before Tax (PBT) fell 16.3% to $556.7M. Income Tax Expense rose to $191.6M (HY2024: $173.9M, or 10.2% higher). Profit for the period from continuing operations amounted to $365.1M, up 17.8% compared to $309.8M in the prior period. MASSY reported profit from discontinued operations of $11.1M (HY2024: $4.4M). Consequently, Profit for the period rose 21.7% to $376.2M compared to $309.2M from the prior period. Overall, Profit Attributable to Owners of the Parent stood at $348.3M, 23.8% higher than the $281.4M reported in the previous period.
Segment Performance Mixed
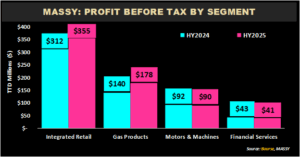
MASSY’s PBT growth in HY2025 was primarily supported by its major segment – Integrated Retail – which resulted in an expansion of 16.3% year on year.
Integrated Retail, the most significant contributor to PBT (63.8%), expanded by 13.8%, from $312M in HY2024 to $355M in HY2025, driven by strong growth in Guyana’s retail and distribution channels. The segment also reportedly benefited from higher gross profit contributions from newly introduced product lines.
Gas Products (32.0% of PBT), the second-largest contributor, advanced by 27.5% from $140M to $178M. According to the Group, this was driven by strong geographic performance—led by manufacturing operations in Trinidad and Tobago, volume growth in Guyana and new customer contracts along with operational enhancements in Colombia.
Motor & Machines, (16.1% of PBT) dropped 2.4% to $90M from $92M in HY2025, as gains in the Group’s Guyana operations were offset by a reportedly weaker construction performance in the Machines segment within the Trinidad and Tobago market.
Financial Services, representing 7.3% of PBT, fell 6.3% quarter on quarter to $41M, relative to $43M in the prior period.
Margins Higher
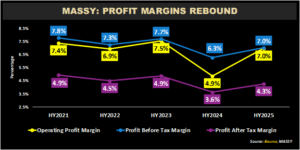
MASSY’s profit margins improved when compared to the prior reporting period. Operating Profit Margin rose to 7.0% compared to 4.9% in HY2024. Profit Before Tax Margin improved to 7.0% in HY2025, from 6.3% a year earlier. Profit after Tax increased from 3.6% to 4.3% in HY2025. According to MASSY, the prior year’s results were impacted by one-off items. The current period’s margins reflect a return to normalized performance, offering a clearer view of the Group’s core operations.
Geographic Diversification Expands
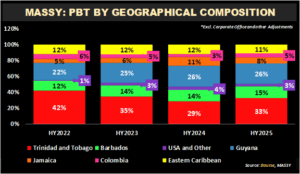
MASSY’s recent acquisitions and diversification across markets continue to drive growth, reflected in its geographic PBT breakdown.
Trinidad & Tobago, the largest geographical contributor to PBT (32.8%), increased 29.9% compared to a year ago, from $167.5M to $217.5M. Guyana’s share of PBT (25.6%) grew by 10.4%, from $153.8M in HY2024 to $169.8M in the current reporting period. Barbados (14.8% of PBT) advanced 16.2% to $84.3M, relative to $97.9M in the prior reporting period. Eastern Caribbean (11.1% of PBT) moved from $70.2M to $74.0M, a 5.4% increase. Notably, Jamaica’s operations (8.0% of PBT) contracted 20.8%, from $66.7M in HY2024 to $52.8M in HY2025. Colombia’s operations contributed 4.7% to PBT, from a prior period $20.1M to current $31.5M (56.3% higher). PBT from U.S.A. operations (3.0%) slid 17.4% from $24.5M to $20.2M. Importantly, PBT outside of Trinidad & Tobago grew 6.3%, as the Group continues its growth strategy for FY2025.
The Bourse View
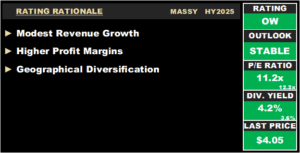
At a current price of $4.05, MASSY trades at a trailing P/E of 11.2 times, below the Conglomerate Sector average of 12.2 times. The Group declared an interim dividend of $0.0354 per share payable on June 27th, 2025, to shareholders on record by May 30th, 2025. The stock offers investors a trailing dividend yield of 4.2%, above the sector average of 3.6%.
MASSY’s strategy includes improving efficiencies of existing businesses as well as pursuing acquisition activity in a disciplined manner, all while ensuring shareholders are rewarded with meaningful cash flows through dividends. On the basis of continued revenue growth, ongoing acquisition activity and expanding geographical diversification, Bourse maintains an OVERWEIGHT rating on MASSY.
GraceKennedy Limited (GKC)
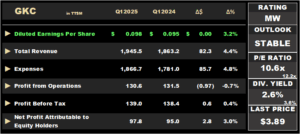
GKC reported a Diluted Earnings per Share (EPS) of TT$0.098 for the three months ended on March 31st, 2025 (Q12025), an increase of 3.2% over the corresponding period in Q12024.
Revenue from Product and Services improved 4.3% from TT$1.8B to TT$1.9B, while Interest Revenue advanced 7.8% to TT$79.0M. Total Revenue climbed 4.4% to TT$1.9B in Q12025 from TT$1.86B in Q12024. Direct and Operating Expenses grew 4.8% to TT$1.9B. Net Impairment Losses on Financial Assets increased to TT$6.2M in Q12025 from TT$5.6M. As a result, Total Expenses expanded by 4.8%. GKC’s Profit from Operations declined marginally by 0.7% from TT$131.5M (Q12024) to TT$130.6M (Q12025). Share of Results of Associates and Joint Ventures increased 10.0% to TT$21.5M compared to the previous comparable period. Profit Before Taxation (PBT) posted a narrow gain of 0.4% amounting to TT$139.0M. Taxation expense moved from TT$37.4M to TT$37.5M. Resultantly, Net Profit for the period remained relatively stable, inching up by 0.4% from TT$101.0M to TT$101.5M in the current review period. In comparison to TT$95.0M recorded in the prior period, Net Profit Attributable to Owners of GKC modestly increased by 3.0% to TT$97.8M in Q12025.
Food Trading Segment Advance
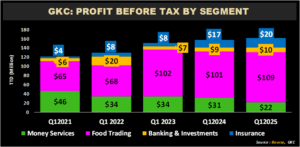
Food Trading, the largest contributor to PBT (67.6% excluding adjustments) climbed 8.2% from TT$101M in Q12024 to TT$109M in Q12025, while completing the 100% acquisition in Catherine’s Peak Bottling Company Limited.
GraceKennedy Money Services (GKMS), the second largest contributor to PBT (13.3% excluding adjustments) dropped 31.1% year-on-year to TT$22M from TT$31M in the prior comparable period, largely due to reduced transaction activity and lower remittance flows in key markets, particularly T&T and Guyana.
The Banking and Investments segment increased 16.0% to TT$10M, driven by growth in the loan portfolio of First Global Bank.
The Group’s Insurance Segment, which accounted for 12.6% of PBT, advanced 22.9% to TT$20M. In March 2025, the Group continued its acquisition program announcing the acquisition of the remaining 27% stake in Key Insurance Company Limited.
Margins decline
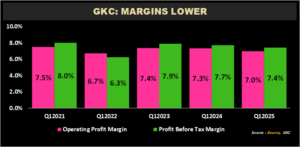
GKC profitability margins narrowed in Q12025 relative to the prior comparable period. Operating Profit Margin fell from 7.3% in Q12024 to 7.0% in Q12025, while Profit Before Tax Margin dropped from 7.7% (Q12024) to 7.4% in the current period. This could be reflective of persistent inflationary pressures within the economic environment.
The Bourse View
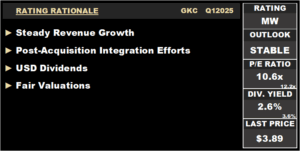
At a current price of $3.89, GKC trades at a P/E ratio of 10.6 times, below the Conglomerate Sector average of 12.2 times. The stock offers investors a trailing dividend yield of 2.6%, below the sector average of 3.6%. The Group announced an interim dividend of TT$0.0229, payable to shareholders on June 20th, 2025. Importantly, GKC’s dividends are paid in US Dollars.
GKC continues to prioritize its growth strategy by actively pursuing new acquisitions and ensuring the smooth integration of existing acquisitions. On the basis of revenue growth and continued acquisition activity, tempered by lower margins, Bourse maintains a MARKETWEIGHT rating on GKC.
“This document has been prepared by Bourse Securities Limited, (“Bourse”), for information purposes only. The production of this publication is not to in any way establish an offer or solicit for the subscription, purchase or sale of any of the securities stated herein to US persons or to contradict any laws of jurisdictions which would interpret our research to be an offer. Any trade in securities recommended herein is done subject to the fact that Bourse, its subsidiaries and/or affiliates have or may have specific or potential conflicts of interest in respect of the security or the issuer of the security, including those arising from (i) trading or dealing in certain securities and acting as an investment advisor; (ii) holding of securities of the issuer as beneficial owner; (iii) having benefitted, benefitting or to benefit from compensation arrangements; (iv) acting as underwriter in any distribution of securities of the issuer in the three years immediately preceding this document; or (v) having direct or indirect financial or other interest in the security or the issuer of the security. Investors are advised accordingly. Neither Bourse nor any of its subsidiaries, affiliates directors, officers, employees, representatives or agents, accepts any liability whatsoever for any direct, indirect or consequential losses arising from the use of this document or its contents or reliance on the information contained herein. Bourse does not guarantee the accuracy or completeness of the information in this document, which may have been obtained from or is based upon trade and statistical services or other third-party sources. The information in this document is not intended to predict actual results and no assurances are given with respect thereto.”