
HIGHLIGHTS
GHL Q12025
- Earnings Per Share (EPS)
- EPS climbed 228.7% from $1.01 to $3.32
- EPS from Continuing Operations declined 46.9% from $0.98 to $0.52
- Performance Drivers:
- Disposal of discontinued operations
- Higher Operating Expenses
- Outlook:
- Cost Management Initiatives
- Rating: Maintained at OVERWEIGHT.
NCBFG HY2025
- Earnings: EPS advanced 89.4% from TT$0.13 to TT$0.24
- Performance Drivers:
- Gain on sale of subsidiary
- Increased Insurance service result
- Higher Net Operating Income
- Outlook:
- Increased growth opportunities
- Rating: Maintained at MARKETWEIGHT.
This week, we at Bourse review the performance of Guardian Holdings Limited (GHL) and NCB Financial Group Limited (NCBFG) for its three months (Q12025) and six months (HY2025) ended March 31st, 2025, respectively. GHL and NCBFG both benefitted from divestment activity. We discuss below.
Guardian Holdings Limited (GHL)
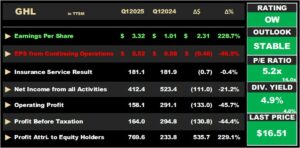
Guardian Holdings Limited (GHL) reported Earnings per Share (EPS) of $3.32 for its first quarter ended March 31st, 2025, up 228.7% from $1.01 in the prior comparable period. Included in Q1 2025’s result was a significant $651M gain recognized from the sale of Thoma Exploitatie B.V. on January 24th, 2025.
EPS from continuing operations amounted to $0.52 per share, 46.9% lower when compared to $0.98 in the prior comparable period.
Insurance Service Result fell marginally by 0.4% from $181.9M in the prior period to $181.1M in Q12025, with increased insurance revenue offset by higher service expenses (+11.9%). Net Income from Investing Activities dropped 19.1% to $431.8M, largely attributable to (i) lower net fair value gains and (ii) increased impairment losses on financial assets. Net insurance finance expenses increased 3.3% to $220.7M in Q12025. Consequently, Net Insurance and Investment Result amounted to $392.2M relative to $501.8M in Q12024, 21.8% lower. Fee and commission income from brokerage activities contracted by $1.4M or 6.5% year-on-year.
Net Income from all activities fell 21.2% to $412.4M in the period under review. Other operating expenses rose 9.7% YoY from $188.4M to $206.7M in Q12025. Operating Profit contracted 45.7% from $291.1M to $158.1M in Q12025. Share of after-tax profits of associated companies advanced 57.3% to $5.9M. Profit Before Taxation amounted to $164.0M, 44.3% lower relative to $294.9M in the prior period. Profit from continuing operations after taxation fell 47.1% from $229.5M in Q12024 to $121.4M in Q12025. Profit from discontinued operations after taxation rose to $649.9M from $7.2M reported in the prior period, mainly driven by a significant gain realized from the sale of Thoma Group. Resultantly, Profit for the Period stood at $771.3M, advancing 225.9% from the prior period of $236.7M. Overall, Profit Attributable to Equity Holders of the Company climbed to $769.6M, (229.1% higher) compared to the profit of $233.8M in the same period last year.
LHP Segment Down
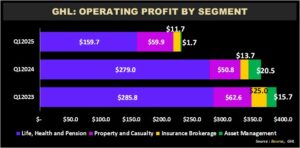
Operating Profit for the period came in at $158.1M during the three–month period, contracting 45.7% from the prior comparable period.
Life, Health and Pension (LHP) (68.5% of operating profit excluding adjustments) declined 42.8% year on year from $279.0M to $159.7M, primarily due to higher insurance finance expenses (despite revenue growth). The Property and Casualty Segment improved 17.9% to $59.9M in Q12025, with higher insurance revenue particularly achieved from Trinidad and Dutch Caribbean operations. Insurance Brokerage dipped to $11.7M, due to lower income from investing activities. Asset Management saw the largest decline, slipping 91.7% from $20.5M in Q12024 to $1.7M in Q12025.
From a value perspective, GHL’s book value per share advanced from $17.00 in Q12024 to $23.26 in the current period under review. GHL’s price to book ratio moved from a high of 1.8 times in Q12023 to a low of 0.7 times in Q12025 (below its five-year average of 1.3 times). This implies that investors are currently paying less on a per-share basis to own net assets of the company, often interpreted as an indicator of value.
The Bourse View
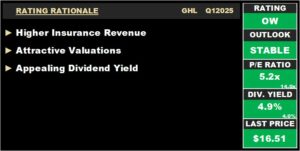
GHL is currently priced at $16.51, up 10.4% year-to-date. GHL trades at a price to earnings ratio of 5.2 times, significantly below the Non-Banking Financial Sector average of 14.0 times. Beginning this financial year, the Group moved from bi-annual to quarterly dividend payments – the first quarterly dividend has been proposed at $0.21 cents per share, to be paid to shareholders on June 11th, 2025. The stock currently offers investors a trailing dividend yield of 4.9%, above the sector average of 4.0%.
Results from continuing operations were adversely affected by volatile financial markets in the first quarter, leading to a substantial decline in net fair value gains. This could normalize, should financial markets improve in subsequent quarters. On the basis of relatively attractive valuation multiples and a reasonably generous dividend yield, Bourse maintains its rating on GHL as OVERWEIGHT.
NCB Financial Group Limited (NCBFG)
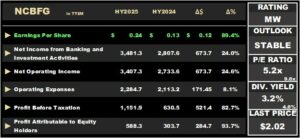
NCB Financial Group Limited (NCBFG) generated an Earnings Per Share (EPS) of TT$0.24 for the six months ended 31st March 2025 (HY2025), advancing 89.4% from TT$0.13 in the prior comparable period (HY2024).
Net Interest Income rose 7.0%, driven by higher yields on interest-earning assets and an expanded investment portfolio, while net fee and commission income declined by 14.3%. Net Income from Banking and Investment Activities increased 24.0%, rising from TT$2.81B in HY2024 to TT$3.48B in the current period, boosted by the gain on sale of subsidiary which amounted to TT$667M. The Insurance Service Result grew 2.6% to TT$421.2M, influenced by a one-off prior period adjustment. Overall, Net Operating Income climbed 24.6% to TT$3.40B in HY2025.
Operating expenses rose 8.1% to TT$2.28B, while Operating Profit jumped 81.0% to TT$1.12B, compared to TT$620.4M in HY2024. Share of Profit from Associates surged 189.8% to TT$29.3M. Profit Before Tax advanced 82.7% to TT$1.15B, up from TT$630.5M, while taxation increased 9.0% to TT$173.2M. Consequently, Net Profit rose to TT$978.7M, an increase of 107.5%. However, excluding the one-off gain from the sale of subsidiary, the current period reflects an adjusted Net Profit of TT$312.0M, 33.8% lower from the prior comparable profit of TT$471.6M in HY2024. Net Profit Attributable to Shareholders increased by 93.8% to TT$588.3M. When adjusted for one-off items, Net Profit Attributable to Shareholders in HY2025 shows a decline by TT$414.5M to TT$173.8M from TT$303.5M in HY2024, representing a 42.7% drop.
Operating Income by Activity
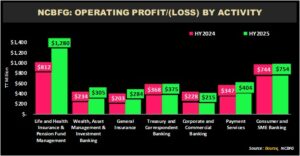
NCBFG’s Operating Profit increased year-over-year, driven by stronger performance in six out of its seven segments.
Life and Health Insurance & Pension Fund Management (LHP) amounted to TT$1.28B compared to TT$812M in the comparable period, a 57.7% increase. According to the Group, the gain from the disposal of the Thoma Group subsidiary is reflected in the segment. Excluding the one-off gain, the LHP segment declined 24.4% YoY to TT$614M.
Wealth, Asset Management and Investment Banking reported TT$234M in operating profit, 8.4% higher than the previous comparable period. General Insurance grew by 40.0% to TT$203M. Treasury and Correspondent Banking expanded by 1.9% from TT$368M to TT$375M in the current period. Payment Services climbed 16.4% to TT$404M in HY2025 compared to TT$347M in the prior period. Consumer and SME Banking Wealth moved from TT$744M to TT$754M, resulting in a 1.4% increase in operating income. The Group’s Corporate and Commercial Banking division contracted 5.7% to TT$228M in HY2025.
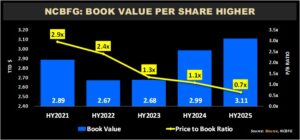
NCBFG’s Book Value Per Share (BVPS) rose from $2.99 in HY2024 to $3.11 in HY2025, driven by growth in retained earnings. Growth in BVPS, combined with a weakening in price, has resulted in a relatively more attractive price-to-book (P/B) ratio of 0.7x, below its five-year average of 1.7x.
The Bourse View
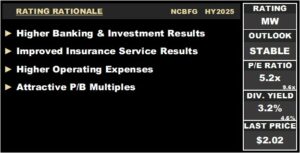
NCBFG currently trades at a price of $2.02 at a trailing P/E ratio of 5.2 times, relative to the Banking Sector average of 9.6 times. The Group declared an interim dividend of TT$0.022 per share which is payable on June 9th, 2025, on record as at May 26th, 2025. The stock offers a dividend yield of 3.2%, below the sector average of 4.6%.
Excluding the one-off gain on sale of its subsidiary, the Group’s improvement in adjusted net operating income would have been more than offset by increases in operating expenses. Notwithstanding this, the Group’s relative valuation from a price-to-book (P/B) multiple perspective appears to be the most attractive of its publicly-listed banking sector peers. On this basis, Bourse maintains a MARKETWEIGHT rating on NCBFG.
“This document has been prepared by Bourse Securities Limited, (“Bourse”), for information purposes only. The production of this publication is not to in any way establish an offer or solicit for the subscription, purchase, or sale of any of the securities stated herein to US persons or to contradict any laws of jurisdictions which would interpret our research to be an offer. Any trade in securities recommended herein is done subject to the fact that Bourse, its subsidiaries and/or affiliates have or may have specific or potential conflicts of interest in respect of the security or the issuer of the security, including those arising from (i) trading or dealing in certain securities and acting as an investment advisor; (ii) holding of securities of the issuer as beneficial owner; (iii) having benefitted, benefitting or to benefit from compensation arrangements; (iv) acting as underwriter in any distribution of securities of the issuer in the three years immediately preceding this document; or (v) having direct or indirect financial or other interest in the security or the issuer of the security. Investors are advised accordingly. Neither Bourse nor any of its subsidiaries, affiliates directors, officers, employees, representatives, or agents, accepts any liability whatsoever for any direct, indirect or consequential losses arising from the use of this document or its contents or reliance on the information contained herein. Bourse does not guarantee the accuracy or completeness of the information in this document, which may have been obtained from or is based upon trade and statistical services or other third-party sources. The information in this document is not intended to predict actual results and no assurances are given with respect thereto.”