HIGHLIGHTS
AMCL FY2024
- Earnings: Diluted Earnings Per Share 10.7% higher, from $3.00 to $3.32
- Performance Drivers:
- Revenue Growth
- Acquisition / Geographical Diversification
- Outlook:
- Suspension of Dividend Payments
- Continued Acquisition Activity
- Rating: Maintained at MARKETWEIGHT
AMBL FY2024
- Earnings: Earnings Per Share up 25.8% from $1.51 to $1.90
- Performance Drivers:
- Higher Operating Income
- Higher Operating Expenses
- Outlook:
- Acquisition Integration
- Rating: Maintained at MARKETWEIGHT
This week we at Bourse review the performance of Ansa McAL Limited (AMCL) for its fiscal year ended December 31st, 2024 (FY2024). While AMCL reported improved revenue and operating margins, the Group’s announcement of a suspension of dividends for the next three years would have been the main focus of investors. The sudden shift in dividend policy brings into question investors trade-off between short-term income loss and potential long-term value creation. We also provide a brief review on Ansa Merchant Bank Limited (AMBL) for its year ended December 31st, 2024. We discuss below.
Ansa McAL Limited (AMCL)
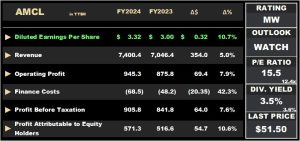
Ansa McAL Limited (AMCL) reported a Diluted Earnings per Share (EPS) of $3.32 for the financial year ended December 31st, 2024 (FY2024), up 10.7% relative to $3.00 reported in the prior comparable period (FY2023).
Revenue advanced 5.0% Year-on-Year (YoY), from $7.0B to $7.4B. Operating Profit climbed 7.9% to $945.3M in comparison to $875.8M, a year earlier. Finance Costs rose 42.3.% to $68.5M in FY2024. Profit Before Tax (PBT) increased 7.6% from $841.8M in FY2023 to $905.8M in FY2024. AMCL’s Share of Result of Associates and Joint Venture Interests grew to $29.1M (+105.1%) from a prior $14.2M. The Group reported taxation expense of $230.3M, with the Effective Tax Rate moving from 29.4% to 25.4%. Overall, Profit Attributable to Equity Holders jumped 10.6% from $516.6M in FY2023 to $571.3M in FY2024.
PBT Advances
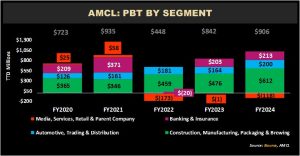
AMCL’s PBT climbed by 7.6% to $906M in FY2024. The Construction, Manufacturing, Packaging & Brewing sector, the largest contributor to PBT (67.6%) rose from $476M in FY2023 to $612M, up 28.7% in FY2024, boosted by higher revenues. Its most recent acquisition of the US-based chlor-alkali producer, BleachTech LLC, which was finalized in November 2024, is expected to be materially accretive to earnings – estimates provided by AMCL suggested an additional $1.00/share in earnings.
The second largest contributor to PBT, Banking and Insurance services (23.5%) advanced 5.0% to $213M in FY2024. Automotive, Trading & Distribution (22.0% of PBT) reported an increase in profitability, up 21.6% to $200M relative to $164M a year earlier. The Media, Services, Retail and Parent Company segment recorded a loss of $118M, wider than the $1M loss recorded in FY2023.
Margins Improve
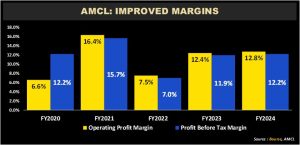
AMCL’s profitability margins increased year-on-year but remained below levels seen in FY2021. For the fiscal year ended 2024, the Operating Profit Margin for AMCL stood at 12.8%, up from 12.4% in FY2023. Profit Before Tax Margin in FY2024 improved to 12.2%, relative to 11.9% in FY2023. The acquisition of BleachTech is likely to influence the Group’s profitability margins going forward, though the precise impact remains uncertain.
The AMCL Dividend Dilemma
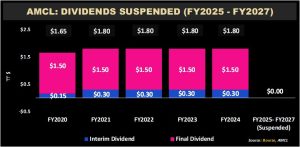
For the fiscal year 2024, AMCL maintained an annual dividend payout of $1.80 per share – consistent with the past three years- with the last interim dividend paid on September 9th, 2024.
In March 2025, the Group announced a three-year temporary suspension of dividend payments from FY2025 – FY2027, reallocating capital towards funding future acquisitions as part of the Company’s strategic ‘2X’ growth initiative to double profits by 2027. This announcement would have come as a surprise to AMCL investors, particularly those that may have been content with a reliable dividend flow from the stock.
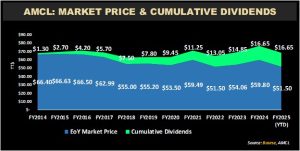
Is the temporary suspension of AMCL’s dividend detrimental to investors? Taking a closer look at AMCL’s return to shareholders from FY2014 to FY2024, AMCL investors experienced a total return (price movement + dividends) of 15.1%.
This return was driven primarily by dividends, which cumulatively amounted to $16.65 per share or 25.1% relative to a price of $66.40 (the price paid to purchase one share of AMCL at the end of 2014.) Over the same period, AMCL’s market price declined by 9.9% falling from $66.40 to $59.80 at the end of 2024. Note: For comparative purposes, the Trinidad and Tobago Composite Index (TTCI) declined by 6.8% over the same period.
The return attribution over the ten-year period highlights the importance of dividends in generating a positive total return to shareholders, with AMCL’s stock price having declined.
With (i) local TTD investment rates higher and (ii) broad investor sentiment lower (as implied by a multi-year decline of local stock values), the suspension of dividend payments – on the perfectly rational basis of redirecting resources to fund acquisitions – is likely to test the resolve of even the most bullish of investors in AMCL. Post-announcement, the price of AMCL has fallen around 10% as at close of trade on Friday.
The Bourse View
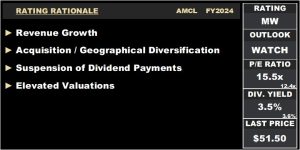
At a current market price of $51.50, AMCL trades at a trailing P/E of 15.5 times, above the Conglomerate sector average of 12.4 times.
According to the Group, its decision to suspend dividends reflects its focus on long-term growth through reinvestment. The Company plans to expand its global footprint by entering new markets and pursuing acquisitions to double its size and scale by 2027. The successful execution of this strategy could likely lead to greater profitability and long-term stock price growth, ultimately benefiting shareholders. During this period of no dividends, AMCL’s demonstration of meaningful earnings growth and continued communication with its shareholders will be important in maintaining confidence in its stock. Accordingly, Bourse maintains a MARKETWEIGHT rating on AMCL.
ANSA Merchant Bank Limited (AMBL)
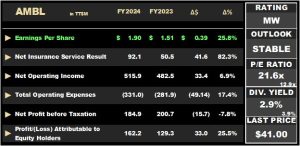
AMBL reported an Earnings Per Share (EPS) of $1.90, representing a 25.8% increase for the full-year period ending December 31, 2024 (FY2024), compared to the preceding period’s EPS of $1.51 (FY2023).
Net Insurance Service Result advanced 82.3%, from $50.5M in the prior period to $92.1M in FY2024. Net Insurance Financial Result reduced to $56.1M in FY2024 from $61.6M in FY2023. Consequently, Revenue from contracts with customers dropped 56.0%, from $21.2M in FY2023 to $9.3M in FY2024. Other income and interest expense both increased by 31.5% and 9.3%, respectively. A Credit loss expense of $9.0M was reported in FY2024, compared to a recovery of $6.3M in FY2023. Resultantly, Net Operating Income grew to $515.9M in FY2024, a 6.9% increase from $482.5M in the previous period. Total Operating Expenses climbed 17.4%, moving from $281.9M in FY2023 to $331.0M in FY2024. As a result, Net Profit Before Taxation declined to $184.9M in the current period, 7.8% lower than $200.7M in FY2023. Taxation contracted to $22.7M, compared to $71.4M in the prior comparable period. Overall, Profit Attributable to Equity Holders was $162.3M in FY2024, up from $129.3M in FY2023.
PBT Falls
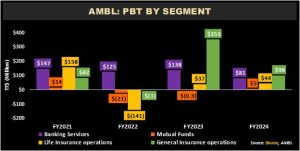
AMBL reported a Profit Before Tax (PBT) of $184.9M for the year ended December 31, 2024, compared to a PBT of $200.7M for the same period previous year.
Banking Services (35.4% before eliminations) saw a 41.5% YoY decline in PBT, dropping from $138M to $81M in FY2024, driven by lower segment revenue and higher operating expenses.
General & Life Insurance Operations (43.1% and 19.2% before eliminations respectively) consists of TATIL, TATIL Life, TATIL RE, Trident, and Colfire. General Insurance Operations saw a 72.1% decline, contributing $98M in the current period, compared to $353M in PBT in FY2023. Life Insurance Operations grew by 16.8%, reaching $44M in FY2024, up from $37M in the prior period.
The Mutual Funds segment (2.3% before eliminations) improved to $5M for the period, after a $0.3M loss in FY2023.
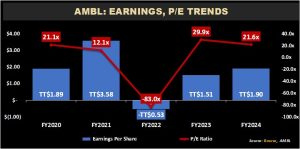
AMBL’s earnings per share (EPS) for FY2024 was reported at $1.90, with the Price-to-Earnings (P/E) ratio currently standing at 21.6 times. This represents an increase from the $1.51 recorded in FY2023 and a decrease from the previous year’s P/E ratio of 29.9 times.
The Bourse View
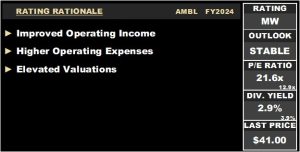
AMBL is currently priced at $41.00, with a trailing dividend yield of 2.9%, below the non-banking sector average of 3.9%. The stock trades at a P/E ratio of 21.6 times, above the sector average of 12.9 times. The Group declared a final dividend of $1.00 per share, payable to shareholders by May 26, 2025, and on record by May 15, 2025. On the basis of improved operating income tempered by higher operating expenses, Bourse maintains a MARKETWEIGHT rating on AMBL.
This document has been prepared by Bourse Securities Limited, (“Bourse”), for information purposes only. The production of this publication is not to in any way establish an offer or solicit for the subscription, purchase or sale of any of the securities stated herein to US persons or to contradict any laws of jurisdictions which would interpret our research to be an offer. Any trade in securities recommended herein is done subject to the fact that Bourse, its subsidiaries and/or affiliates have or may have specific or potential conflicts of interest in respect of the security or the issuer of the security, including those arising from (i) trading or dealing in certain securities and acting as an investment advisor; (ii) holding of securities of the issuer as beneficial owner; (iii) having benefitted, benefitting or to benefit from compensation arrangements; (iv) acting as underwriter in any distribution of securities of the issuer in the three years immediately preceding this document; or (v) having direct or indirect financial or other interest in the security or the issuer of the security. Investors are advised accordingly. Neither Bourse nor any of its subsidiaries, affiliates directors, officers, employees, representatives or agents, accepts any liability whatsoever for any direct, indirect or consequential losses arising from the use of this document or its contents or reliance on the information contained herein. Bourse does not guarantee the accuracy or completeness of the information in this document, which may have been obtained from or is based upon trade and statistical services or other third-party sources. The information in this document is not intended to predict actual results and no assurances are given with respect thereto.”